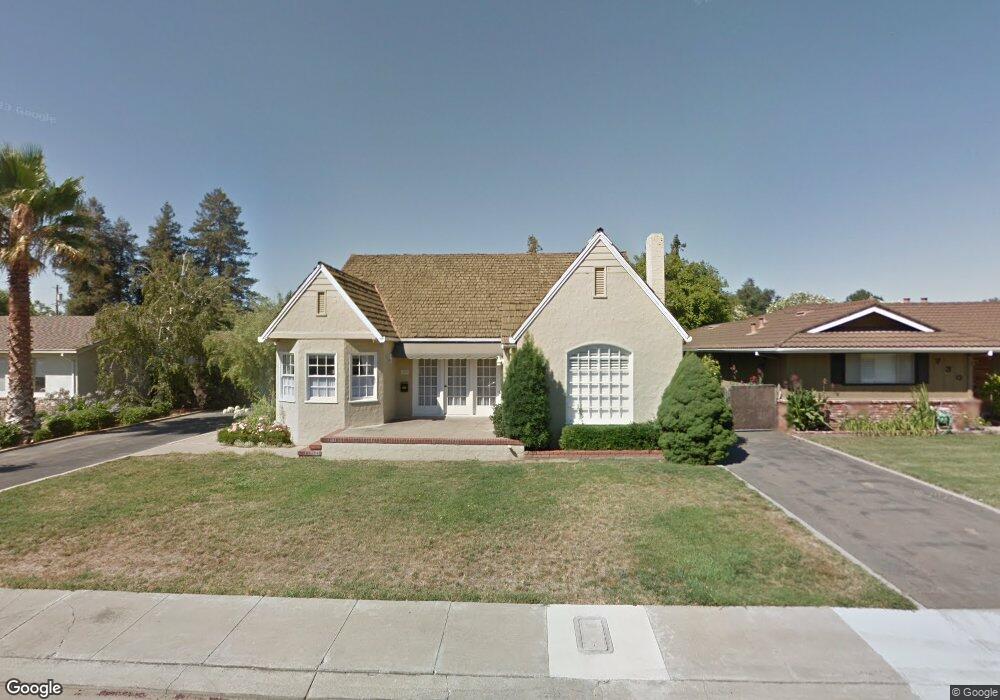
728 N 3rd St Patterson, CA 95363
Estimated Value: $640,000 - $695,000
4
Beds
3
Baths
2,760
Sq Ft
$243/Sq Ft
Est. Value
About This Home
This home is located at 728 N 3rd St, Patterson, CA 95363 and is currently estimated at $669,470, approximately $242 per square foot. 728 N 3rd St is a home located in Stanislaus County with nearby schools including Northmead Elementary School, Creekside Middle School, and Patterson High School.
Ownership History
Date
Name
Owned For
Owner Type
Purchase Details
Closed on
Apr 1, 2024
Sold by
Maring Katie Lynne and Shotwell Katie Lynne
Bought by
Medina Diane Marie and Medina Mario Marcos
Current Estimated Value
Home Financials for this Owner
Home Financials are based on the most recent Mortgage that was taken out on this home.
Original Mortgage
$425,000
Outstanding Balance
$418,674
Interest Rate
6.9%
Mortgage Type
New Conventional
Estimated Equity
$250,796
Purchase Details
Closed on
Dec 27, 2011
Sold by
Castro Margaret F and Castro Family 2006 Trust
Bought by
Maring Katie Lynne
Home Financials for this Owner
Home Financials are based on the most recent Mortgage that was taken out on this home.
Original Mortgage
$152,000
Interest Rate
3.85%
Mortgage Type
New Conventional
Purchase Details
Closed on
Jun 7, 2006
Sold by
Castro Henry and Castro Margaret F
Bought by
Castro Henry and Castro Margaret F
Create a Home Valuation Report for This Property
The Home Valuation Report is an in-depth analysis detailing your home's value as well as a comparison with similar homes in the area
Home Values in the Area
Average Home Value in this Area
Purchase History
| Date | Buyer | Sale Price | Title Company |
|---|---|---|---|
| Medina Diane Marie | $675,000 | Wfg National Title Insurance C | |
| Maring Katie Lynne | -- | Chicago Title Company | |
| Castro Henry | -- | None Available |
Source: Public Records
Mortgage History
| Date | Status | Borrower | Loan Amount |
|---|---|---|---|
| Open | Medina Diane Marie | $425,000 | |
| Previous Owner | Maring Katie Lynne | $152,000 |
Source: Public Records
Tax History Compared to Growth
Tax History
| Year | Tax Paid | Tax Assessment Tax Assessment Total Assessment is a certain percentage of the fair market value that is determined by local assessors to be the total taxable value of land and additions on the property. | Land | Improvement |
|---|---|---|---|---|
| 2024 | $2,590 | $226,030 | $30,779 | $195,251 |
| 2023 | $2,530 | $221,599 | $30,176 | $191,423 |
| 2022 | $2,398 | $217,255 | $29,585 | $187,670 |
| 2021 | $2,348 | $212,996 | $29,005 | $183,991 |
| 2020 | $2,349 | $210,813 | $28,708 | $182,105 |
| 2019 | $2,311 | $206,681 | $28,146 | $178,535 |
| 2018 | $2,197 | $202,630 | $27,595 | $175,035 |
| 2017 | $2,150 | $198,657 | $27,054 | $171,603 |
| 2016 | $1,816 | $169,763 | $26,524 | $143,239 |
| 2015 | $1,788 | $167,214 | $26,126 | $141,088 |
| 2014 | $1,746 | $163,940 | $25,615 | $138,325 |
Source: Public Records
Map
Nearby Homes