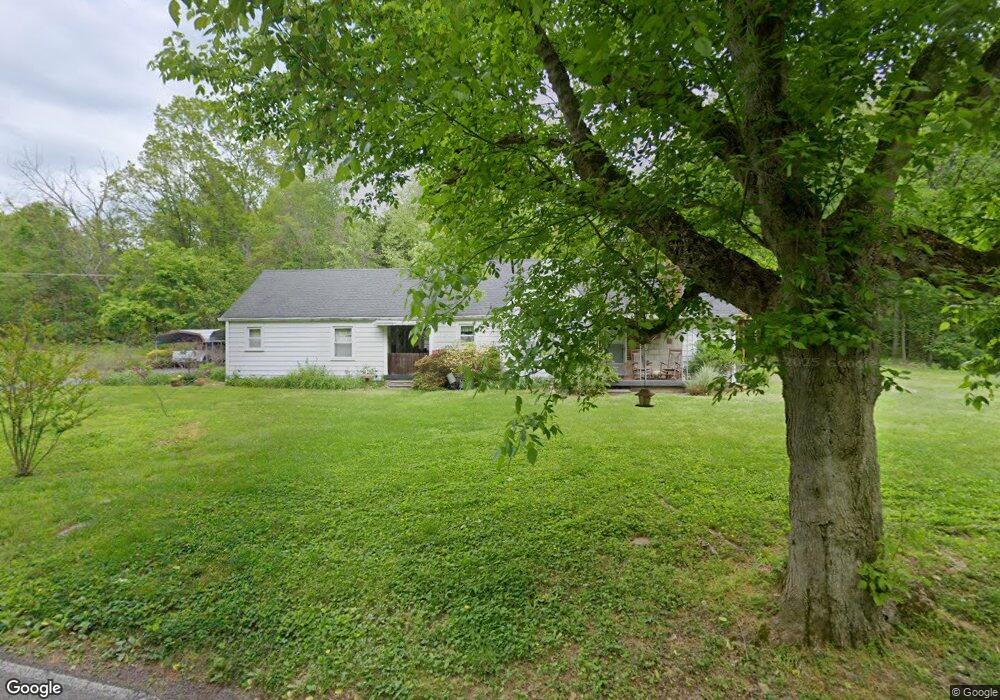
7301 Sleepy Hollow Rd Fairview, TN 37062
Estimated Value: $389,000 - $2,829,000
--
Bed
1
Bath
1,494
Sq Ft
$762/Sq Ft
Est. Value
About This Home
This home is located at 7301 Sleepy Hollow Rd, Fairview, TN 37062 and is currently estimated at $1,138,399, approximately $761 per square foot. 7301 Sleepy Hollow Rd is a home located in Williamson County with nearby schools including Fairview Elementary School, Fairview Middle School, and Fairview High School.
Ownership History
Date
Name
Owned For
Owner Type
Purchase Details
Closed on
Sep 10, 2003
Sold by
Fisher Betty Jean
Bought by
Mitchell Lenard M and Mitchell Viki S
Current Estimated Value
Purchase Details
Closed on
Dec 28, 2001
Sold by
Fisher Betty Jean
Bought by
Fisher Betty Jean
Create a Home Valuation Report for This Property
The Home Valuation Report is an in-depth analysis detailing your home's value as well as a comparison with similar homes in the area
Home Values in the Area
Average Home Value in this Area
Purchase History
| Date | Buyer | Sale Price | Title Company |
|---|---|---|---|
| Mitchell Lenard M | $25,000 | -- | |
| Fisher Betty Jean | -- | -- |
Source: Public Records
Tax History Compared to Growth
Tax History
| Year | Tax Paid | Tax Assessment Tax Assessment Total Assessment is a certain percentage of the fair market value that is determined by local assessors to be the total taxable value of land and additions on the property. | Land | Improvement |
|---|---|---|---|---|
| 2025 | $1,135 | $57,325 | $31,050 | $26,275 |
| 2024 | $1,135 | $41,175 | $18,500 | $22,675 |
| 2023 | $1,049 | $38,050 | $18,500 | $19,550 |
| 2022 | $1,049 | $38,050 | $18,500 | $19,550 |
| 2021 | $2,813 | $149,650 | $130,100 | $19,550 |
| 2020 | $2,227 | $100,300 | $86,725 | $13,575 |
| 2019 | $2,227 | $100,300 | $86,725 | $13,575 |
| 2018 | $2,156 | $100,300 | $86,725 | $13,575 |
| 2017 | $2,136 | $100,300 | $86,725 | $13,575 |
| 2016 | $0 | $100,300 | $86,725 | $13,575 |
| 2015 | -- | $77,525 | $65,950 | $11,575 |
| 2014 | -- | $77,525 | $65,950 | $11,575 |
Source: Public Records
Map
Nearby Homes
- Fairview Tn 37062
- 7340 Southern Rd
- 7327 Mccormick Dr
- 7305 Williamsport Ct
- 7348 Overby Rd
- 2003 Case Way
- 1033 Brayden Dr
- 1047 Brayden Dr
- 1060 Brayden Dr
- 1010 Brayden Dr
- 7270 Old Franklin Rd
- 1080 Brayden Dr
- 6005 Venable Ct
- Hartley Plan at Ashlyn
- Ashton Plan at Ashlyn
- Mason Plan at Ashlyn
- Carlton Plan at Ashlyn
- Adriana Plan at Ashlyn
- Harlow Plan at Ashlyn
- Heathrow Plan at Ashlyn
- 7209 Sleepy Hollow Rd
- 7420 Sleepy Hollow Rd
- 7410 Sleepy Hollow Rd
- 7214 Sleepy Hollow Rd
- 7222 Sleepy Hollow Rd
- 7212 Sleepy Hollow Rd
- 7205 Sleepy Hollow Rd
- 7323 Henry Dr
- 7319 Henry Dr
- 7315 Henry Dr
- 7313 Henry Dr
- 7206 Sleepy Hollow Rd
- 7202 Sleepy Hollow Rd
- 7311 Henry Dr
- 7313 Henry Dr
- 7448 Sleepy Hollow Rd
- 7119 Sleepy Hollow Rd
- 7309 Henry Dr
- 7452 Sleepy Hollow Rd
- 7117 Sleepy Hollow Rd