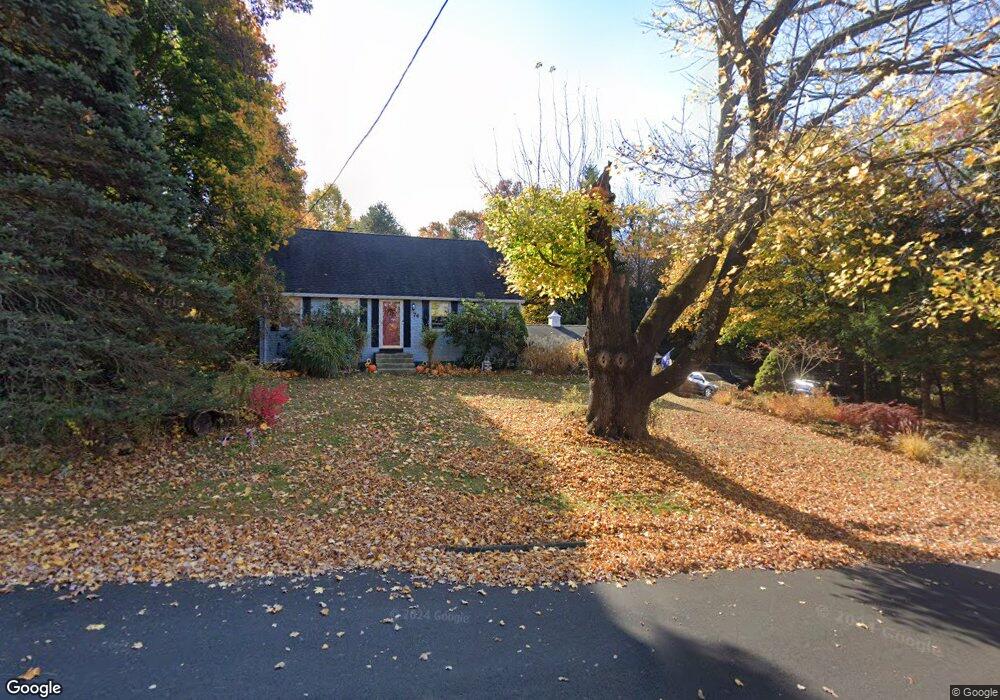
74 Indian Trail Bristol, CT 06010
South Bristol NeighborhoodEstimated Value: $442,000 - $507,000
4
Beds
2
Baths
1,939
Sq Ft
$238/Sq Ft
Est. Value
About This Home
This home is located at 74 Indian Trail, Bristol, CT 06010 and is currently estimated at $460,674, approximately $237 per square foot. 74 Indian Trail is a home located in Hartford County with nearby schools including Chippens Hill Middle School, Bristol Central High School, and Immanuel Lutheran School.
Ownership History
Date
Name
Owned For
Owner Type
Purchase Details
Closed on
Jun 8, 2009
Sold by
Longbrake John
Bought by
Mayle Brian
Current Estimated Value
Home Financials for this Owner
Home Financials are based on the most recent Mortgage that was taken out on this home.
Original Mortgage
$216,015
Outstanding Balance
$136,922
Interest Rate
4.83%
Estimated Equity
$323,752
Purchase Details
Closed on
Sep 28, 2005
Sold by
Bradt Kyle P and Bradt Janet B
Bought by
Longbrake John and Martone Mary Ellen
Home Financials for this Owner
Home Financials are based on the most recent Mortgage that was taken out on this home.
Original Mortgage
$261,250
Interest Rate
7.62%
Purchase Details
Closed on
Jun 28, 2004
Sold by
Lareau Robert R
Bought by
Bradt Kyle P and Bradt Janet B
Home Financials for this Owner
Home Financials are based on the most recent Mortgage that was taken out on this home.
Original Mortgage
$211,120
Interest Rate
6.32%
Purchase Details
Closed on
May 12, 2003
Sold by
Passig Russell R and Passig Sharon L
Bought by
Lareau Robert R
Create a Home Valuation Report for This Property
The Home Valuation Report is an in-depth analysis detailing your home's value as well as a comparison with similar homes in the area
Home Values in the Area
Average Home Value in this Area
Purchase History
| Date | Buyer | Sale Price | Title Company |
|---|---|---|---|
| Mayle Brian | $220,000 | -- | |
| Longbrake John | $275,000 | -- | |
| Bradt Kyle P | $263,900 | -- | |
| Lareau Robert R | $209,000 | -- |
Source: Public Records
Mortgage History
| Date | Status | Borrower | Loan Amount |
|---|---|---|---|
| Open | Lareau Robert R | $216,015 | |
| Previous Owner | Lareau Robert R | $261,250 | |
| Previous Owner | Lareau Robert R | $211,120 |
Source: Public Records
Tax History Compared to Growth
Tax History
| Year | Tax Paid | Tax Assessment Tax Assessment Total Assessment is a certain percentage of the fair market value that is determined by local assessors to be the total taxable value of land and additions on the property. | Land | Improvement |
|---|---|---|---|---|
| 2025 | $7,669 | $227,220 | $46,550 | $180,670 |
| 2024 | $7,237 | $227,220 | $46,550 | $180,670 |
| 2023 | $6,896 | $227,220 | $46,550 | $180,670 |
| 2022 | $6,126 | $159,740 | $34,580 | $125,160 |
| 2021 | $6,126 | $159,740 | $34,580 | $125,160 |
| 2020 | $6,126 | $159,740 | $34,580 | $125,160 |
| 2019 | $6,078 | $159,740 | $34,580 | $125,160 |
| 2018 | $5,891 | $159,740 | $34,580 | $125,160 |
| 2017 | $5,622 | $156,030 | $49,420 | $106,610 |
| 2016 | $5,622 | $156,030 | $49,420 | $106,610 |
| 2015 | $5,400 | $156,030 | $49,420 | $106,610 |
| 2014 | $5,400 | $156,030 | $49,420 | $106,610 |
Source: Public Records
Map
Nearby Homes
- 66 Mattatuck Rd
- 351 Witches Rock Rd
- 32 Cameron Dr
- 26 Kilmartin Ave
- 489 Wolcott St Unit 46
- 489 Wolcott St Unit 47
- 489 Wolcott St Unit 74
- 489 Wolcott St Unit 25
- 489 Wolcott St Unit 85
- 155 Melinda Ln
- 121 Barclare Ln
- 30 Cedar Ave
- 140 Corbin Ridge
- 123 Corbin Ridge
- 156 Corbin Ridge
- 145 Corbin Ridge
- 101 Corbin Ridge
- 41 Long Swamp Rd
- 1253 Spindle Hill Rd
- 48 Cancellaro Dr