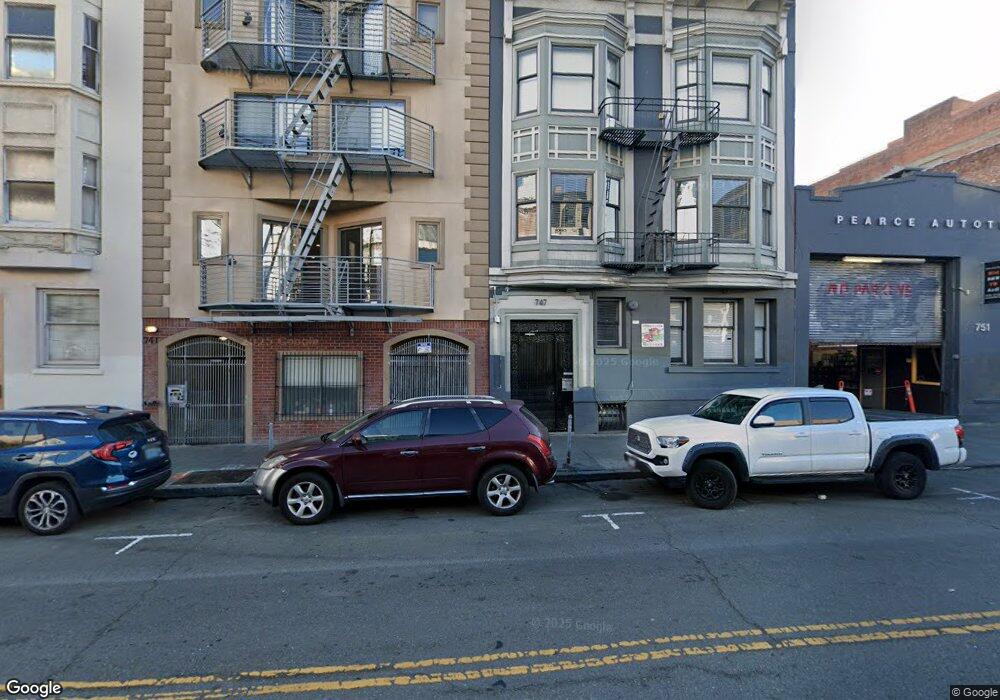
741 Ellis St Unit 4 San Francisco, CA 94109
Tenderloin NeighborhoodEstimated Value: $904,000
3
Beds
2
Baths
1,214
Sq Ft
$745/Sq Ft
Est. Value
About This Home
This home is located at 741 Ellis St Unit 4, San Francisco, CA 94109 and is currently estimated at $904,000, approximately $744 per square foot. 741 Ellis St Unit 4 is a home located in San Francisco County with nearby schools including Tenderloin Community Elementary School, Francisco Middle School, and San Francisco City Academy.
Ownership History
Date
Name
Owned For
Owner Type
Purchase Details
Closed on
Apr 29, 2019
Sold by
Chu Nana and Chu Yun May
Bought by
C6 Condos Llc
Current Estimated Value
Purchase Details
Closed on
Dec 22, 2017
Sold by
Base Camp 7 Llc
Bought by
Chu Li Kun and Chu Chen Chuan
Home Financials for this Owner
Home Financials are based on the most recent Mortgage that was taken out on this home.
Original Mortgage
$235,000
Interest Rate
3.94%
Mortgage Type
Purchase Money Mortgage
Purchase Details
Closed on
Nov 26, 2013
Sold by
Walley Timothy F and Walley Jacqueline P
Bought by
Base Camp 7 Llc
Home Financials for this Owner
Home Financials are based on the most recent Mortgage that was taken out on this home.
Original Mortgage
$2,000,000
Interest Rate
4.23%
Mortgage Type
Purchase Money Mortgage
Create a Home Valuation Report for This Property
The Home Valuation Report is an in-depth analysis detailing your home's value as well as a comparison with similar homes in the area
Home Values in the Area
Average Home Value in this Area
Purchase History
| Date | Buyer | Sale Price | Title Company |
|---|---|---|---|
| C6 Condos Llc | -- | Old Republic Title Company | |
| Chu Nana | -- | Old Republic Title Company | |
| Chu Li Kun | -- | Old Republic Title Company | |
| Chu Li Kun | $1,874,933 | Old Republic Title Co | |
| Base Camp 7 Llc | $3,800,000 | Chicago Title Company |
Source: Public Records
Mortgage History
| Date | Status | Borrower | Loan Amount |
|---|---|---|---|
| Previous Owner | Chu Li Kun | $235,000 | |
| Previous Owner | Base Camp 7 Llc | $2,000,000 |
Source: Public Records
Tax History Compared to Growth
Tax History
| Year | Tax Paid | Tax Assessment Tax Assessment Total Assessment is a certain percentage of the fair market value that is determined by local assessors to be the total taxable value of land and additions on the property. | Land | Improvement |
|---|---|---|---|---|
| 2025 | $9,494 | $727,597 | $363,799 | $363,798 |
| 2024 | $9,494 | $713,331 | $427,999 | $285,332 |
| 2023 | $9,664 | $1,000,088 | $500,044 | $500,044 |
| 2022 | $12,604 | $980,480 | $490,240 | $490,240 |
| 2021 | $12,375 | $961,256 | $480,628 | $480,628 |
| 2020 | $17,085 | $1,335,400 | $667,700 | $667,700 |
| 2019 | $12,983 | $947,392 | $473,696 | $473,696 |
| 2018 | $7,859 | $608,710 | $304,355 | $304,355 |
| 2017 | $7,469 | $596,776 | $298,388 | $298,388 |
| 2016 | $7,327 | $585,076 | $292,538 | $292,538 |
| 2015 | $5,314 | $413,972 | $204,932 | $209,040 |
| 2014 | $5,176 | $405,864 | $200,918 | $204,946 |
Source: Public Records
Map
Nearby Homes
- 677 Ellis St
- 669 Ellis St
- 719 Larkin St Unit 502
- 790 Ellis St
- 484-488 Eddy St
- 16 Dodge Place
- 222 Hyde St
- 440 Hyde St
- 750 Van Ness Ave Unit V502
- 750 Van Ness Ave Unit 1106
- 537 Hyde St
- 151 Alice b Toklas Place Unit 703
- 151 Alice b Toklas Place Unit 506
- 555 Hyde St
- 631 Ofarrell St Unit 416
- 631 Ofarrell St Unit 510
- 631 Ofarrell St Unit 610
- 631 Ofarrell St Unit 2002
- 631 Ofarrell St Unit 812
- 926 Larkin St
- 741 Ellis St
- 741 Ellis St Unit 9
- 741 Ellis St Unit 8
- 741 Ellis St Unit 7
- 741 Ellis St Unit 6
- 741 Ellis St Unit 5
- 741 Ellis St Unit 3
- 741 Ellis St Unit 2
- 741 Ellis St Unit 1
- 747 Ellis St
- 717 Ellis St
- 655 Larkin St
- 645 Larkin St
- 645 Larkin St Unit 2
- 637 Larkin St
- 620 Eddy St
- 625 Larkin St Unit 403
- 625 Larkin St Unit 402
- 625 Larkin St Unit 302
- 625 Larkin St Unit 2