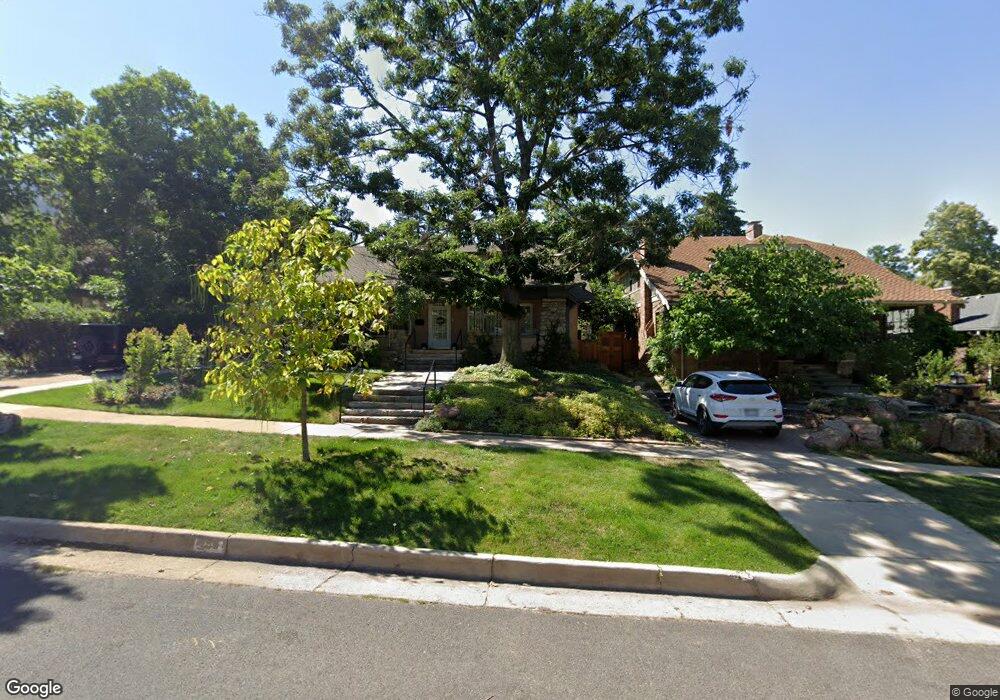
766 10th St Boulder, CO 80302
University Hill NeighborhoodEstimated Value: $1,338,452 - $1,923,000
4
Beds
2
Baths
1,340
Sq Ft
$1,198/Sq Ft
Est. Value
About This Home
This home is located at 766 10th St, Boulder, CO 80302 and is currently estimated at $1,605,113, approximately $1,197 per square foot. 766 10th St is a home located in Boulder County with nearby schools including Flatirons Elementary School, Manhattan Middle School of the Arts & Academics, and Boulder High School.
Ownership History
Date
Name
Owned For
Owner Type
Purchase Details
Closed on
Oct 3, 2017
Sold by
Crenshaw June
Bought by
Crenshaw June and 10Th St Trust
Current Estimated Value
Purchase Details
Closed on
Aug 25, 2017
Sold by
Crenshaw June and Lombardi John A
Bought by
Crenshaw June
Purchase Details
Closed on
May 10, 1994
Sold by
Crenshaw June
Bought by
Crenshaw June
Home Financials for this Owner
Home Financials are based on the most recent Mortgage that was taken out on this home.
Original Mortgage
$180,000
Interest Rate
8.4%
Purchase Details
Closed on
Oct 26, 1993
Sold by
Gardner Kenneth
Bought by
Crenshaw June
Purchase Details
Closed on
Jun 11, 1986
Bought by
June Crenshaw and Lombardi John A
Purchase Details
Closed on
Jun 21, 1971
Bought by
June Crenshaw and Lombardi John A
Create a Home Valuation Report for This Property
The Home Valuation Report is an in-depth analysis detailing your home's value as well as a comparison with similar homes in the area
Home Values in the Area
Average Home Value in this Area
Purchase History
We collect this data history from publicly available records. To have your information removed, we recommend requesting removal directly through your county’s website.
| Date | Buyer | Sale Price | Title Company |
|---|---|---|---|
| Crenshaw June | -- | None Available | |
| Crenshaw June | -- | None Available | |
| Crenshaw June | -- | -- | |
| Crenshaw June | -- | -- | |
| June Crenshaw | $160,000 | -- | |
| June Crenshaw | $28,000 | -- |
Source: Public Records
Mortgage History
We collect this data history from publicly available records. To have your information removed, we recommend requesting removal directly through your county’s website.
| Date | Status | Borrower | Loan Amount |
|---|---|---|---|
| Closed | Crenshaw June | $180,000 |
Source: Public Records
Tax History
| Year | Tax Paid | Tax Assessment Tax Assessment Total Assessment is a certain percentage of the fair market value that is determined by local assessors to be the total taxable value of land and additions on the property. | Land | Improvement |
|---|---|---|---|---|
| 2025 | $8,104 | $99,267 | $73,046 | $26,221 |
| 2024 | $7,782 | $91,238 | $67,138 | $24,100 |
| 2023 | $7,647 | $95,247 | $68,407 | $30,525 |
| 2022 | $6,886 | $81,100 | $56,045 | $25,055 |
| 2021 | $6,566 | $83,434 | $57,658 | $25,776 |
| 2020 | $6,102 | $77,256 | $48,048 | $29,208 |
| 2019 | $6,009 | $77,256 | $48,048 | $29,208 |
| 2018 | $4,932 | $64,080 | $42,984 | $21,096 |
| 2017 | $4,777 | $79,600 | $47,521 | $32,079 |
| 2016 | $5,536 | $63,951 | $39,402 | $24,549 |
| 2015 | $5,242 | $56,356 | $27,780 | $28,576 |
| 2014 | $4,738 | $56,356 | $27,780 | $28,576 |
Source: Public Records
Map
Nearby Homes
- 757 12th St
- 856 10th St
- 650 12th St
- 800 Grant Place
- 715 14th St
- 110 Chautauqua Park
- 943 10th St
- 114 Chautauqua Park
- 1225 Mariposa Ave
- 789 15th St
- 333 Bellevue Dr
- 1333 Mariposa Ave
- 815 16th St
- 770 6th St
- 820 6th St
- 1031 14th St
- 1200 College Ave Unit 118
- 1200 College Ave Unit 121
- 1200 College Ave Unit 102
- 1090 11th St
Your Personal Tour Guide
Ask me questions while you tour the home.