

773 E 5th St Unit 1 Boston, MA 02127
South Boston Neighborhood
1
Bed
1
Bath
560
Sq Ft
$114/mo
HOA Fee
About This Home
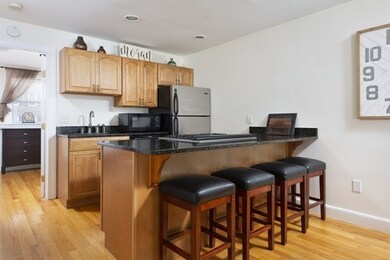
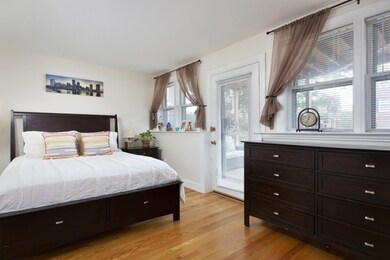
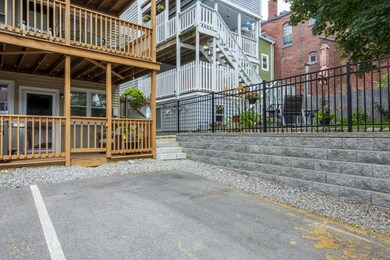
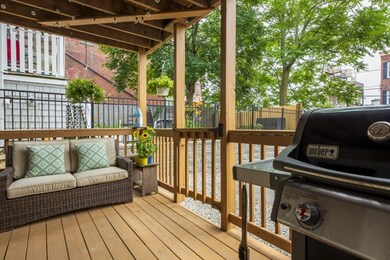
As of September 2019*** 8/5 OPEN HOUSE CANCELED DUE TO ACCEPTED OFFER *** Conveniently located a quick walk to the South Boston beaches, public transportation, the Broadway shops and minutes to the South Boston Seaport area - you will not want to miss out on this perfectly situated East Side unit WITH PARKING! This very well maintained 1 Bed, 1 Bath features red oak floors throughout, working fireplace, central air/forced heat fired by gas and in-unit W/D. Kitchen and living room have an open floor plan with larger island - perfect for entertaining guests! Bedroom is large enough to fit a king size bed and features his & her closet space. Private deck off of bedroom offers a cute outside oasis that leads directly to your assigned parking space! Showings to start at first open house on Sunday, August 4th - 12-2pm and Monday, August 5th - 5:30-7pm. Sellers reserve all rights to accept offer at their discretion. Please see "Firm Remarks" for offer package details.
Property Details
Home Type
- Condominium
Est. Annual Taxes
- $5,593
Year Built
- Built in 1988
HOA Fees
- $114 per month
Utilities
- Forced Air Heating and Cooling System
- Heating System Uses Gas
- Natural Gas Water Heater
Listing and Financial Details
- Assessor Parcel Number W:06 P:04204 S:102
Ownership History
Date
Name
Owned For
Owner Type
Purchase Details
Listed on
Jul 31, 2019
Closed on
Aug 27, 2019
Sold by
Moran Christopher J
Bought by
Stpierre Donna
Seller's Agent
Jackie Rooney
Rooney Real Estate, LLC
Buyer's Agent
Lisa Sullivan
Churchill Properties
List Price
$489,000
Sold Price
$515,000
Premium/Discount to List
$26,000
5.32%
Current Estimated Value
Home Financials for this Owner
Home Financials are based on the most recent Mortgage that was taken out on this home.
Estimated Appreciation
$44,536
Avg. Annual Appreciation
1.41%
Original Mortgage
$412,000
Outstanding Balance
$365,488
Interest Rate
3.7%
Mortgage Type
New Conventional
Estimated Equity
$193,539
Purchase Details
Closed on
Apr 14, 2017
Sold by
James Moran T
Bought by
Moran Christopher J
Home Financials for this Owner
Home Financials are based on the most recent Mortgage that was taken out on this home.
Original Mortgage
$257,500
Interest Rate
4.1%
Mortgage Type
New Conventional
Purchase Details
Listed on
Mar 31, 2013
Closed on
Jun 21, 2013
Sold by
Regan Margaret A
Bought by
James Moran T
Seller's Agent
Margaret Hurley
Keller Williams Realty
Buyer's Agent
Margaret Hurley
Keller Williams Realty
List Price
$339,000
Sold Price
$329,000
Premium/Discount to List
-$10,000
-2.95%
Home Financials for this Owner
Home Financials are based on the most recent Mortgage that was taken out on this home.
Avg. Annual Appreciation
4.49%
Purchase Details
Closed on
Aug 16, 2004
Sold by
Hoarty Brendan P
Bought by
Regan Margaret A
Home Financials for this Owner
Home Financials are based on the most recent Mortgage that was taken out on this home.
Original Mortgage
$271,700
Interest Rate
6.16%
Mortgage Type
Purchase Money Mortgage
Purchase Details
Closed on
Dec 22, 2003
Sold by
Hudson Robert G and Flaherty Robert G
Bought by
Hoarty Brendan P
Purchase Details
Closed on
May 13, 1996
Sold by
Hennessey Enterprises
Bought by
Hudson Robert G
Purchase Details
Closed on
Nov 3, 1993
Sold by
East Fifth Inc
Bought by
Ttac Rt and Stevens Maureen
Purchase Details
Closed on
Jul 28, 1992
Sold by
Joan Rt
Bought by
East Fifth Inc
Purchase Details
Closed on
Jan 6, 1989
Sold by
Coviello Robert
Bought by
Arrigal Patricia A
Similar Homes in the area
Create a Home Valuation Report for This Property
The Home Valuation Report is an in-depth analysis detailing your home's value as well as a comparison with similar homes in the area
Home Values in the Area
Average Home Value in this Area
Purchase History
| Date | Type | Sale Price | Title Company |
|---|---|---|---|
| Not Resolvable | $515,000 | -- | |
| Deed | $357,500 | -- | |
| Not Resolvable | $329,000 | -- | |
| Deed | $286,000 | -- | |
| Deed | $185,000 | -- | |
| Deed | $71,000 | -- | |
| Deed | $160,000 | -- | |
| Foreclosure Deed | $215,000 | -- | |
| Foreclosure Deed | $215,000 | -- | |
| Deed | $91,900 | -- |
Source: Public Records
Mortgage History
| Date | Status | Loan Amount | Loan Type |
|---|---|---|---|
| Open | $412,000 | New Conventional | |
| Previous Owner | $257,500 | New Conventional | |
| Previous Owner | $251,000 | No Value Available | |
| Previous Owner | $271,500 | No Value Available | |
| Previous Owner | $271,700 | Purchase Money Mortgage |
Source: Public Records
Property History
| Date | Event | Price | Change | Sq Ft Price |
|---|---|---|---|---|
| 09/06/2019 09/06/19 | Sold | $515,000 | +5.3% | $920 / Sq Ft |
| 08/05/2019 08/05/19 | Pending | -- | -- | -- |
| 07/31/2019 07/31/19 | For Sale | $489,000 | 0.0% | $873 / Sq Ft |
| 09/01/2016 09/01/16 | Rented | $2,100 | -4.5% | -- |
| 08/30/2016 08/30/16 | Under Contract | -- | -- | -- |
| 08/06/2016 08/06/16 | Price Changed | $2,200 | -12.0% | $4 / Sq Ft |
| 08/01/2016 08/01/16 | For Rent | $2,500 | 0.0% | -- |
| 06/21/2013 06/21/13 | Sold | $329,000 | -2.9% | $598 / Sq Ft |
| 04/10/2013 04/10/13 | Pending | -- | -- | -- |
| 03/31/2013 03/31/13 | For Sale | $339,000 | -- | $616 / Sq Ft |
Source: MLS Property Information Network (MLS PIN)
Tax History Compared to Growth
Tax History
| Year | Tax Paid | Tax Assessment Tax Assessment Total Assessment is a certain percentage of the fair market value that is determined by local assessors to be the total taxable value of land and additions on the property. | Land | Improvement |
|---|---|---|---|---|
| 2025 | $5,593 | $483,000 | $0 | $483,000 |
| 2024 | $5,345 | $490,400 | $0 | $490,400 |
| 2023 | $5,159 | $480,400 | $0 | $480,400 |
| 2022 | $5,024 | $461,800 | $0 | $461,800 |
| 2021 | $4,831 | $452,800 | $0 | $452,800 |
| 2020 | $4,122 | $390,300 | $0 | $390,300 |
| 2019 | $3,846 | $364,900 | $0 | $364,900 |
| 2018 | $3,641 | $347,400 | $0 | $347,400 |
| 2017 | $3,280 | $309,700 | $0 | $309,700 |
| 2016 | $3,214 | $292,200 | $0 | $292,200 |
| 2015 | $3,265 | $269,600 | $0 | $269,600 |
| 2014 | $3,028 | $240,700 | $0 | $240,700 |
Source: Public Records
Agents Affiliated with this Home
-
Jackie Rooney
Seller's Agent in 2019
Jackie Rooney
Rooney Real Estate, LLC
(617) 645-5370
117 in this area
130 Total Sales
-
Lisa Sullivan
Buyer's Agent in 2019
Lisa Sullivan
Churchill Properties
(978) 578-5013
69 Total Sales
-
Bob Nelson
Seller's Agent in 2016
Bob Nelson
RE/MAX
(617) 268-5100
5 in this area
11 Total Sales
-
Nathaniel Goodrich
N
Buyer's Agent in 2016
Nathaniel Goodrich
Compass
6 Total Sales
-
Margaret Hurley
Seller's Agent in 2013
Margaret Hurley
Keller Williams Realty
(617) 319-1330
8 in this area
18 Total Sales
Map
Source: MLS Property Information Network (MLS PIN)
MLS Number: 72542344
APN: SBOS-000000-000006-004204-000102
Disclaimer: Certain information contained herein is derived from information provided by parties other than Homes.com. All information provided is deemed reliable, but is not guaranteed to be accurate and should be independently verified.
![]() The property listing data and information, or the Images, set forth herein were provided to MLS Property Information Network, Inc. from third party sources, including sellers, lessors and public records, and were compiled by MLS Property Information Network, Inc. The property listing data and information, and the Images, are for the personal, non-commercial use of consumers having a good faith interest in purchasing or leasing listed properties of the type displayed to them and may not be used for any purpose other than to identify prospective properties which such consumers may have a good faith interest in purchasing or leasing. MLS Property Information Network, Inc. and its subscribers disclaim any and all representations and warranties as to the accuracy of the property listing data and information, or as to the accuracy of any of the Images, set forth herein.
The property listing data and information, or the Images, set forth herein were provided to MLS Property Information Network, Inc. from third party sources, including sellers, lessors and public records, and were compiled by MLS Property Information Network, Inc. The property listing data and information, and the Images, are for the personal, non-commercial use of consumers having a good faith interest in purchasing or leasing listed properties of the type displayed to them and may not be used for any purpose other than to identify prospective properties which such consumers may have a good faith interest in purchasing or leasing. MLS Property Information Network, Inc. and its subscribers disclaim any and all representations and warranties as to the accuracy of the property listing data and information, or as to the accuracy of any of the Images, set forth herein.
Nearby Homes
- 720 E 5th St Unit 720
- 17 Swallow St
- 15-17 Swallow St Unit 2
- 110 O St Unit 1
- 819 E 4th St
- 734 E 6th St Unit 2
- 786 E 6th St Unit 788
- 870 E 4th St Unit 1
- 805 E 4th St Unit 2
- 722 E 6th St
- 815 E 5th St Unit 9
- 159 O St Unit 2
- 893 E 4th St
- 852 E Broadway Unit 3
- 782 E 4th St
- 823 E Broadway Unit 2
- 901 E Broadway Unit 1
- 838 E Broadway Unit 3
- 838 E Broadway Unit 7
- 817 E Broadway Unit 1