Estimated Value: $3,401,534 - $3,629,000
5
Beds
7
Baths
8,993
Sq Ft
$389/Sq Ft
Est. Value
About This Home
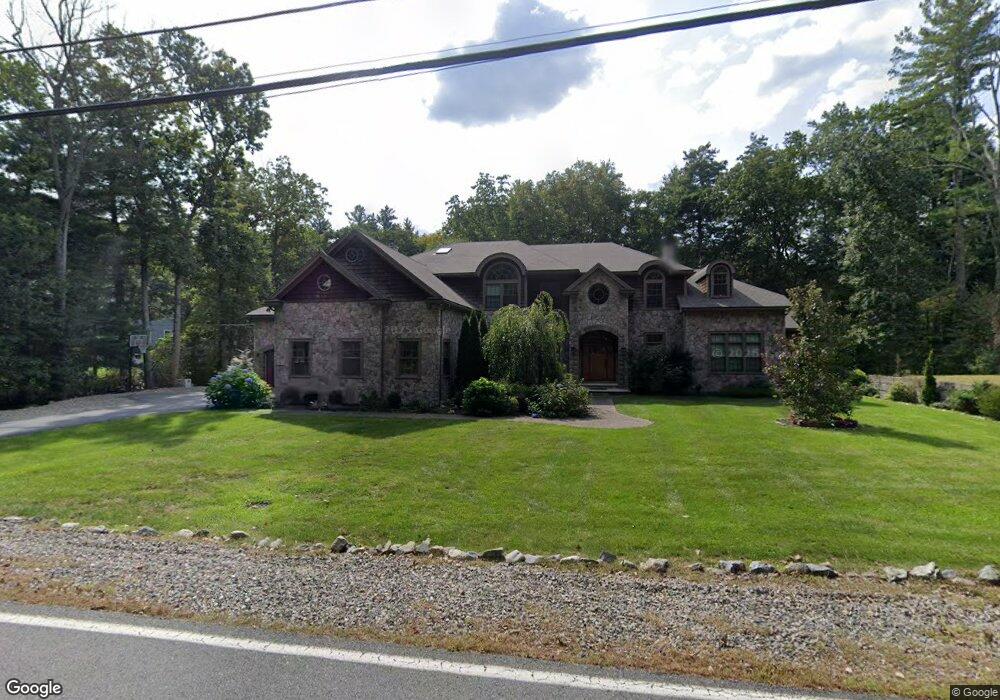
This home is located at 78 Claybrook Rd, Dover, MA 02030 and is currently estimated at $3,501,884, approximately $389 per square foot. 78 Claybrook Rd is a home located in Norfolk County with nearby schools including Chickering Elementary School, Dover-Sherborn Regional Middle School, and Dover-Sherborn Regional High School.
Ownership History
Date
Name
Owned For
Owner Type
Purchase Details
Closed on
Jun 29, 2001
Sold by
Finnegan Robert E
Bought by
Farooqi Sadaf T
Current Estimated Value
Home Financials for this Owner
Home Financials are based on the most recent Mortgage that was taken out on this home.
Original Mortgage
$357,000
Interest Rate
7.14%
Mortgage Type
Purchase Money Mortgage
Purchase Details
Closed on
Aug 20, 1997
Sold by
Muehleman Frank
Bought by
Finnegan Robert F and Finnegan Kelley A
Purchase Details
Closed on
Jul 2, 1990
Sold by
Marsden William
Bought by
Muehleman Frank
Create a Home Valuation Report for This Property
The Home Valuation Report is an in-depth analysis detailing your home's value as well as a comparison with similar homes in the area
Home Values in the Area
Average Home Value in this Area
Purchase History
| Date | Buyer | Sale Price | Title Company |
|---|---|---|---|
| Farooqi Sadaf T | $510,000 | -- | |
| Finnegan Robert F | $347,700 | -- | |
| Muehleman Frank | $307,000 | -- |
Source: Public Records
Mortgage History
| Date | Status | Borrower | Loan Amount |
|---|---|---|---|
| Open | Muehleman Frank | $1,800,000 | |
| Closed | Muehleman Frank | $357,000 |
Source: Public Records
Tax History Compared to Growth
Tax History
| Year | Tax Paid | Tax Assessment Tax Assessment Total Assessment is a certain percentage of the fair market value that is determined by local assessors to be the total taxable value of land and additions on the property. | Land | Improvement |
|---|---|---|---|---|
| 2025 | $31,240 | $2,772,000 | $574,700 | $2,197,300 |
| 2024 | $31,272 | $2,853,300 | $574,700 | $2,278,600 |
| 2023 | $30,081 | $2,467,700 | $501,800 | $1,965,900 |
| 2022 | $27,908 | $2,247,000 | $460,400 | $1,786,600 |
| 2021 | $28,964 | $2,247,000 | $460,400 | $1,786,600 |
| 2020 | $27,596 | $2,149,200 | $460,400 | $1,688,800 |
| 2019 | $27,789 | $2,149,200 | $460,400 | $1,688,800 |
| 2018 | $26,490 | $2,063,100 | $419,000 | $1,644,100 |
| 2017 | $26,923 | $2,063,100 | $419,000 | $1,644,100 |
| 2016 | $27,361 | $2,124,300 | $398,300 | $1,726,000 |
| 2015 | $26,979 | $2,124,300 | $398,300 | $1,726,000 |
Source: Public Records
Map
Nearby Homes
- 60 Claybrook Rd
- 62 Claybrook Rd
- 4 Claybrook Rd
- 60 Main St
- 12 Haven St
- 18 Old Colony Dr
- 365 Charles River St
- 169 Claybrook Rd
- 60 Locust Ln
- 78 Pheasant Landing Rd
- 1780 Central Ave
- 3 Burnham Rd
- 46 Charles River St
- 52 Willow St
- 182 Winding River Rd
- 193 Winding River Rd
- 1345 South St Unit 1345
- 37 Carleton Dr
- 1 Windsor Rd
- 34 Stratford Rd
- 82 Claybrook Rd
- 74 Claybrook Rd
- 72 Claybrook Rd
- 83 Claybrook Rd
- 6 Troutbrook Rd
- 3 Riverside Dr
- 4 Riverside Dr
- 4 Riverside Dr Unit 1
- Four Riverside Dr
- 73 Claybrook Rd
- 71 Claybrook Rd
- 7 Riverside Dr
- 7 Troutbrook Rd
- 10 Riverside Dr
- 0 Chickering Dr (Off) L: Unit 71260852
- 0 Chickering Dr (Off) L: Unit 71343348
- 90 Claybrook Rd
- 66 Claybrook Rd
- 98 Claybrook Rd
- 64 Claybrook Rd