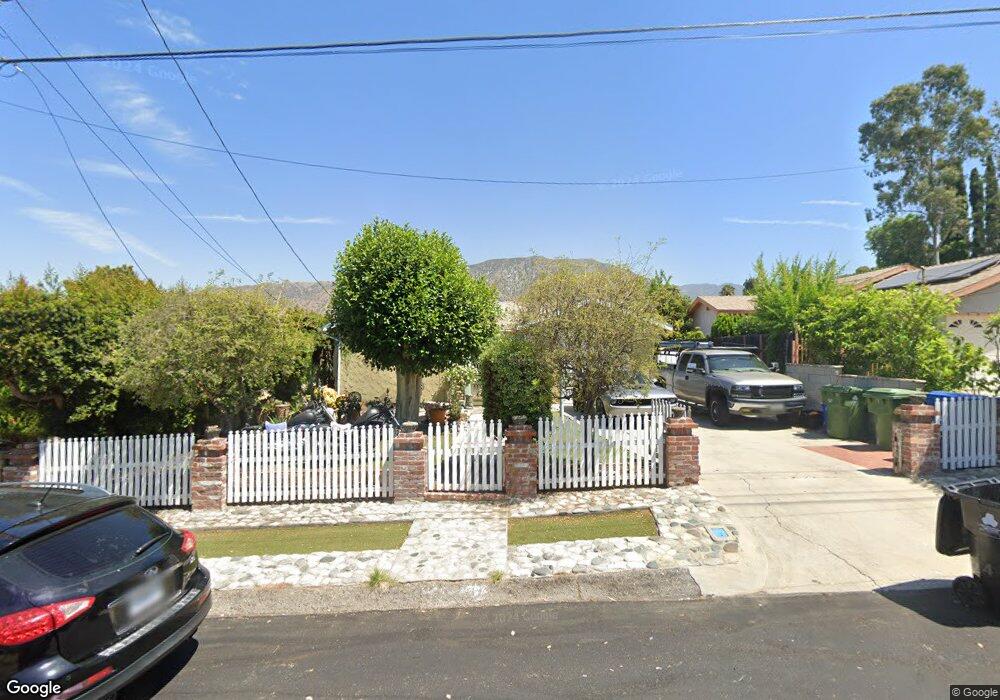
7863 Kyle St Sunland, CA 91040
Sunland NeighborhoodEstimated Value: $867,528 - $925,000
3
Beds
2
Baths
1,542
Sq Ft
$579/Sq Ft
Est. Value
About This Home
This home is located at 7863 Kyle St, Sunland, CA 91040 and is currently estimated at $892,632, approximately $578 per square foot. 7863 Kyle St is a home located in Los Angeles County with nearby schools including Mt. Gleason Middle School, Verdugo Hills Senior High School, and Plainview Academic Charter Academy.
Ownership History
Date
Name
Owned For
Owner Type
Purchase Details
Closed on
Mar 16, 2010
Sold by
Ramirez Ana Ruth
Bought by
Ramirez Ana Ruth and The Ana Ruth Ramirez Revocable Living Tr
Current Estimated Value
Purchase Details
Closed on
Feb 17, 1995
Sold by
Obregon Guadalupe
Bought by
Ramirez Jose Nelson
Home Financials for this Owner
Home Financials are based on the most recent Mortgage that was taken out on this home.
Original Mortgage
$59,500
Interest Rate
8.77%
Create a Home Valuation Report for This Property
The Home Valuation Report is an in-depth analysis detailing your home's value as well as a comparison with similar homes in the area
Home Values in the Area
Average Home Value in this Area
Purchase History
| Date | Buyer | Sale Price | Title Company |
|---|---|---|---|
| Ramirez Ana Ruth | -- | None Available | |
| Ramirez An Ruth | -- | None Available | |
| Ramirez Ana Ruth | -- | None Available | |
| Ramirez Jose Nelson | $85,000 | Fidelity National Title |
Source: Public Records
Mortgage History
| Date | Status | Borrower | Loan Amount |
|---|---|---|---|
| Previous Owner | Ramirez Jose Nelson | $59,500 |
Source: Public Records
Tax History Compared to Growth
Tax History
| Year | Tax Paid | Tax Assessment Tax Assessment Total Assessment is a certain percentage of the fair market value that is determined by local assessors to be the total taxable value of land and additions on the property. | Land | Improvement |
|---|---|---|---|---|
| 2025 | $2,704 | $211,001 | $100,764 | $110,237 |
| 2024 | $2,704 | $206,865 | $98,789 | $108,076 |
| 2023 | $2,655 | $202,809 | $96,852 | $105,957 |
| 2022 | $2,536 | $198,833 | $94,953 | $103,880 |
| 2021 | $2,497 | $194,936 | $93,092 | $101,844 |
| 2019 | $2,424 | $189,156 | $90,332 | $98,824 |
| 2018 | $2,315 | $185,448 | $88,561 | $96,887 |
| 2016 | $2,195 | $178,249 | $85,123 | $93,126 |
| 2015 | $2,164 | $175,573 | $83,845 | $91,728 |
| 2014 | $2,178 | $172,135 | $82,203 | $89,932 |
Source: Public Records
Map
Nearby Homes
- 7755 Forsythe St
- 7851 Fenwick St
- 10607 Whitegate Ave
- 10623 Woodward Ave
- 10531 Greenburn Ave
- 10529 Mount Gleason Ave
- 10549 Rhodesia Ave
- 10833 Mcvine Ave
- 8230 Kyle St
- 10554 Plainview Ave
- 10434 Irma Ave
- 10919 Odell Ave
- 8100 Foothill Blvd Unit 1
- 8100 Foothill Blvd Unit 3
- 10415 Mcvine Ave Unit 2
- 8347 Grenoble St Unit 9
- 10704 Oro Vista Ave
- 0 Alethea Dr
- 10816 Redmont Ave
- 10626 Mountair Ave