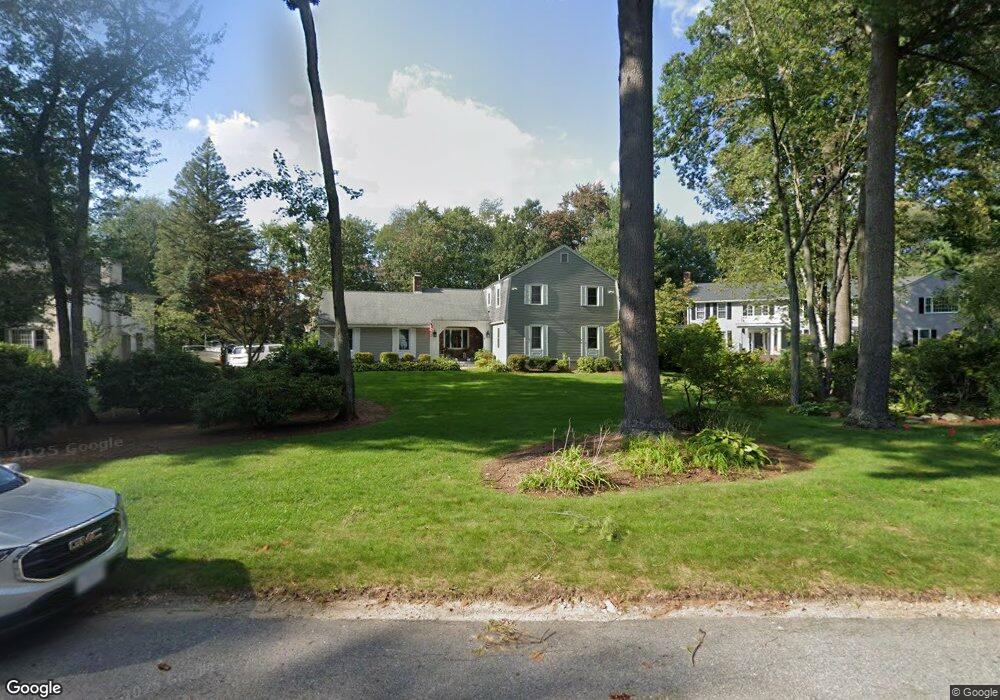
8 Alonesos Way Andover, MA 01810
West Andover NeighborhoodEstimated Value: $1,323,500 - $1,617,000
4
Beds
3
Baths
3,000
Sq Ft
$500/Sq Ft
Est. Value
About This Home
This home is located at 8 Alonesos Way, Andover, MA 01810 and is currently estimated at $1,499,625, approximately $499 per square foot. 8 Alonesos Way is a home located in Essex County with nearby schools including Henry C. Sanborn Elementary School, Andover West Middle School, and Andover High School.
Ownership History
Date
Name
Owned For
Owner Type
Purchase Details
Closed on
Jul 22, 2005
Sold by
Shea Janet L Est and Shea
Bought by
Durant Kelly Miskell and Durant Paul J
Current Estimated Value
Create a Home Valuation Report for This Property
The Home Valuation Report is an in-depth analysis detailing your home's value as well as a comparison with similar homes in the area
Home Values in the Area
Average Home Value in this Area
Purchase History
| Date | Buyer | Sale Price | Title Company |
|---|---|---|---|
| Durant Kelly Miskell | $750,000 | -- | |
| Durant Kelly Miskell | $750,000 | -- |
Source: Public Records
Mortgage History
| Date | Status | Borrower | Loan Amount |
|---|---|---|---|
| Open | Durant Kelly Miskell | $579,200 | |
| Closed | Durant Kelly Miskell | $518,000 | |
| Closed | Durant Kelly Miskell | $518,000 |
Source: Public Records
Tax History Compared to Growth
Tax History
| Year | Tax Paid | Tax Assessment Tax Assessment Total Assessment is a certain percentage of the fair market value that is determined by local assessors to be the total taxable value of land and additions on the property. | Land | Improvement |
|---|---|---|---|---|
| 2024 | $14,357 | $1,114,700 | $591,000 | $523,700 |
| 2023 | $13,818 | $1,011,600 | $532,300 | $479,300 |
| 2022 | $13,039 | $893,100 | $462,900 | $430,200 |
| 2021 | $12,518 | $818,700 | $420,700 | $398,000 |
| 2020 | $12,043 | $802,300 | $410,400 | $391,900 |
| 2019 | $11,985 | $784,900 | $398,500 | $386,400 |
| 2018 | $11,585 | $740,700 | $383,200 | $357,500 |
| 2017 | $11,122 | $732,700 | $375,500 | $357,200 |
| 2016 | $10,899 | $735,400 | $375,500 | $359,900 |
| 2015 | $10,513 | $702,300 | $360,900 | $341,400 |
Source: Public Records
Map
Nearby Homes
- 4 Hazelwood Cir
- 15 Geneva Rd
- 14 Geneva Rd
- 18 Bryan Ln Unit 18
- 18 Dale St Unit 4G
- 105 Central St
- 103 Central St
- 22 Haggetts Pond Rd
- 58 Blanchard St
- 37 Crenshaw Ln Unit 37
- 69 Blanchard St
- 47 Abbot St
- 101 Bellevue Rd
- 14 Regis Rd
- 25 Clubview Dr Unit 25
- 13 Clubview Dr Unit 13
- 38 Lincoln Cir E
- 42 Stevens St
- 3 West Hollow
- 31 Porter Rd