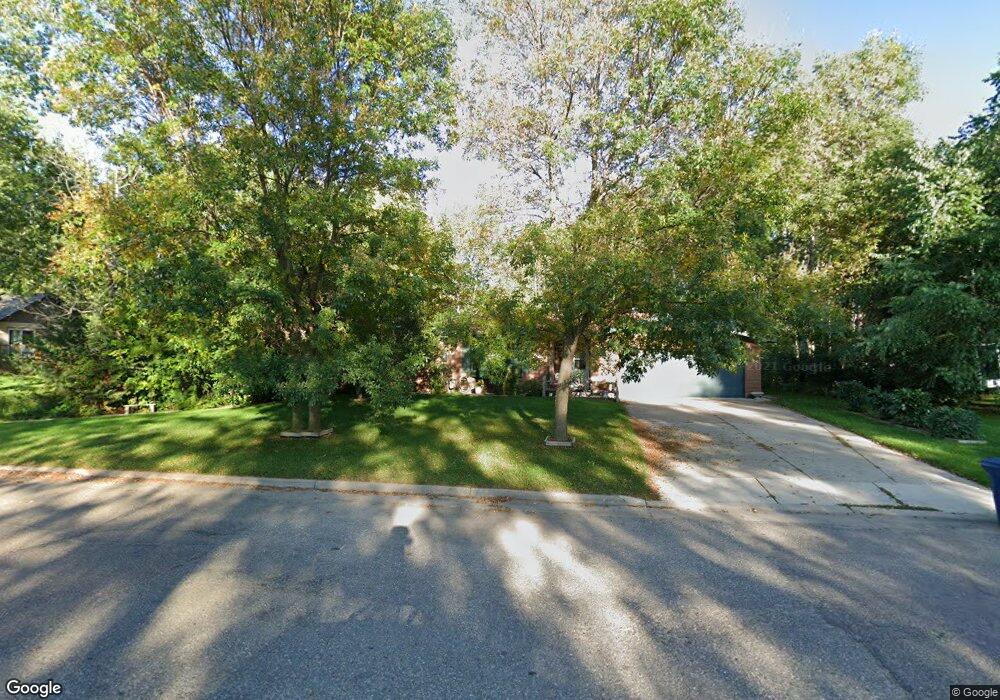
801 Beech St Brainerd, MN 56401
Estimated Value: $238,000 - $287,000
2
Beds
1
Bath
1,060
Sq Ft
$243/Sq Ft
Est. Value
About This Home
This home is located at 801 Beech St, Brainerd, MN 56401 and is currently estimated at $257,506, approximately $242 per square foot. 801 Beech St is a home located in Crow Wing County with nearby schools including Harrison Elementary School, Forestview Middle School, and Brainerd Senior High School.
Ownership History
Date
Name
Owned For
Owner Type
Purchase Details
Closed on
Jan 1, 2003
Sold by
Gottsch Harry N and Gottsch Barbara
Bought by
Kapuska Walter and Kapuska Judith
Current Estimated Value
Purchase Details
Closed on
May 1, 1999
Sold by
Davis Jeanne L and Davis S
Bought by
Gottsch Harry N
Purchase Details
Closed on
Apr 1, 1999
Sold by
Elsenpeter John P
Bought by
Davis Jeanne L
Purchase Details
Closed on
Mar 1, 1999
Sold by
Struthers Galen Er
Bought by
Elsenpeter John P
Create a Home Valuation Report for This Property
The Home Valuation Report is an in-depth analysis detailing your home's value as well as a comparison with similar homes in the area
Home Values in the Area
Average Home Value in this Area
Purchase History
| Date | Buyer | Sale Price | Title Company |
|---|---|---|---|
| Kapuska Walter | $116,500 | -- | |
| Gottsch Harry N | $8,500 | -- | |
| Davis Jeanne L | $9,000 | -- | |
| Elsenpeter John P | $4,000 | -- |
Source: Public Records
Tax History
| Year | Tax Paid | Tax Assessment Tax Assessment Total Assessment is a certain percentage of the fair market value that is determined by local assessors to be the total taxable value of land and additions on the property. | Land | Improvement |
|---|---|---|---|---|
| 2025 | $2,088 | $227,000 | $56,000 | $171,000 |
| 2024 | $2,088 | $219,600 | $51,800 | $167,800 |
| 2023 | $2,060 | $228,600 | $47,400 | $181,200 |
| 2022 | $1,714 | $197,700 | $40,000 | $157,700 |
| 2021 | $1,738 | $141,600 | $35,500 | $106,100 |
| 2020 | $1,668 | $138,300 | $36,300 | $102,000 |
| 2019 | $1,562 | $129,100 | $36,300 | $92,800 |
| 2018 | $1,394 | $121,900 | $36,300 | $85,600 |
| 2017 | $1,358 | $90,072 | $27,993 | $62,079 |
| 2016 | $1,374 | $89,100 | $28,600 | $60,500 |
| 2015 | $1,258 | $81,500 | $24,100 | $57,400 |
| 2014 | $577 | $81,000 | $23,100 | $57,900 |
Source: Public Records
Map
Nearby Homes
- 2814 Blair St
- 2814 Addison Ave
- TBD Oak St
- 2913 Blair St
- 970 York Ct
- 978 York Ct
- 780 Holton Ave
- 1049 Holton Ave
- 973 Holton Ave
- 959 Holton Ave
- 949 Holton Ave
- 753 Holton Ave
- 1822 Oak St
- 3AC Liberty Ln
- 1724 Laurel St
- 1310 Portland Ave
- 414 SE 14th St
- Tract B Minnesota 210
- 1314 Norwood St
- 1306 Chicago Ave SE
Your Personal Tour Guide
Ask me questions while you tour the home.