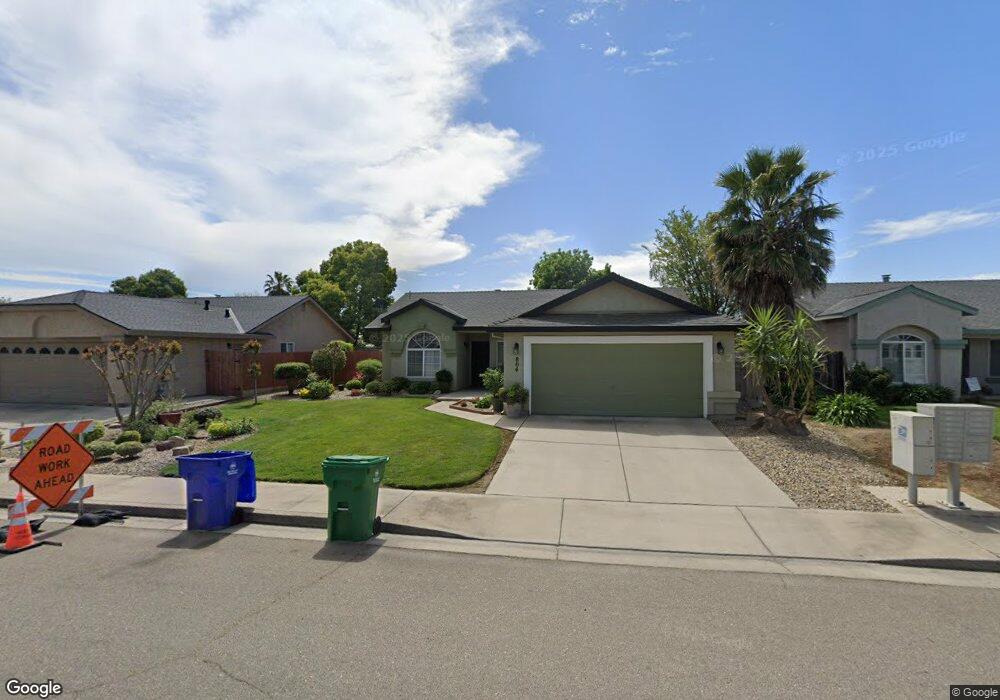
804 Magnolia St Atwater, CA 95301
Estimated Value: $348,000 - $385,000
2
Beds
2
Baths
1,171
Sq Ft
$313/Sq Ft
Est. Value
About This Home
This home is located at 804 Magnolia St, Atwater, CA 95301 and is currently estimated at $366,630, approximately $313 per square foot. 804 Magnolia St is a home located in Merced County with nearby schools including Elmer Wood Elementary School, Mitchell Intermediate School, and Atwater High School.
Ownership History
Date
Name
Owned For
Owner Type
Purchase Details
Closed on
Jun 24, 2010
Sold by
Rivera Peter
Bought by
Rivera Peter and Rivera Rita
Current Estimated Value
Purchase Details
Closed on
Mar 12, 2010
Sold by
Mitchell Lucy Mae
Bought by
Rivera Peter
Home Financials for this Owner
Home Financials are based on the most recent Mortgage that was taken out on this home.
Original Mortgage
$107,142
Outstanding Balance
$71,082
Interest Rate
5%
Mortgage Type
New Conventional
Estimated Equity
$295,548
Purchase Details
Closed on
Sep 27, 2005
Sold by
Deen David Wesley
Bought by
Mitchell Lucy Mae
Home Financials for this Owner
Home Financials are based on the most recent Mortgage that was taken out on this home.
Original Mortgage
$265,500
Interest Rate
6.5%
Mortgage Type
New Conventional
Purchase Details
Closed on
Jun 5, 1997
Sold by
Deen Lydia A
Bought by
Deen Rudolph M
Create a Home Valuation Report for This Property
The Home Valuation Report is an in-depth analysis detailing your home's value as well as a comparison with similar homes in the area
Home Values in the Area
Average Home Value in this Area
Purchase History
| Date | Buyer | Sale Price | Title Company |
|---|---|---|---|
| Rivera Peter | -- | None Available | |
| Rivera Peter | $105,000 | Transcounty Title Company | |
| Mitchell Lucy Mae | $295,000 | Transcounty Title Company | |
| Deen Rudolph M | -- | Transcounty Title Company | |
| Green Edna R | $93,000 | Transcounty Title Company |
Source: Public Records
Mortgage History
| Date | Status | Borrower | Loan Amount |
|---|---|---|---|
| Open | Rivera Peter | $107,142 | |
| Previous Owner | Mitchell Lucy Mae | $265,500 |
Source: Public Records
Tax History Compared to Growth
Tax History
| Year | Tax Paid | Tax Assessment Tax Assessment Total Assessment is a certain percentage of the fair market value that is determined by local assessors to be the total taxable value of land and additions on the property. | Land | Improvement |
|---|---|---|---|---|
| 2025 | $1,410 | $135,520 | $10,320 | $125,200 |
| 2024 | $1,410 | $132,864 | $10,118 | $122,746 |
| 2023 | $1,370 | $130,260 | $9,920 | $120,340 |
| 2022 | $1,342 | $127,707 | $9,726 | $117,981 |
| 2021 | $1,342 | $125,204 | $9,536 | $115,668 |
| 2020 | $1,326 | $123,921 | $9,439 | $114,482 |
| 2019 | $1,262 | $121,492 | $9,254 | $112,238 |
| 2018 | $1,229 | $119,111 | $9,073 | $110,038 |
| 2017 | $1,212 | $116,777 | $8,896 | $107,881 |
| 2016 | $1,164 | $114,488 | $8,722 | $105,766 |
| 2015 | $1,184 | $112,769 | $8,591 | $104,178 |
| 2014 | $1,155 | $110,561 | $8,423 | $102,138 |
Source: Public Records
Map
Nearby Homes
- 1220 Bellevue Rd
- 3216 Heather Glen Ln
- 0 Alabama St Unit MC25081689
- 0 Alabama St Unit MC25081688
- 0 Alabama St Unit MC25081690
- 0 Redwood Ave Unit 225133534
- 0 Redwood Ave Unit MC25237349
- 2709 Hillcrest St
- 207 Waterfront Ct
- 205 Clipper Ct
- 2198 5th St
- 1485 Mulberry Ave
- 190 Tammy Dr
- 5607 Celestial Dr
- 352 Terri Dr
- 3336 Lagoon Ave
- 3386 Lagoon Ave
- 2900 Muir Ave Unit 85
- 210 Kelly Ct
- 1739 1st St
- 800 Magnolia St
- 808 Magnolia St
- 2817 Redwood Ave
- 812 Magnolia St
- 712 Magnolia St
- 713 Los Altos Dr
- 801 Magnolia St
- 809 Magnolia St
- 2813 Redwood Ave
- 900 Magnolia St
- 708 Magnolia St
- 813 Magnolia St
- 709 Los Altos Dr
- 713 Magnolia St
- 2809 Redwood Ave
- 901 Magnolia St
- 904 Magnolia St
- 704 Magnolia St
- 705 Los Altos Dr
- 709 Magnolia St