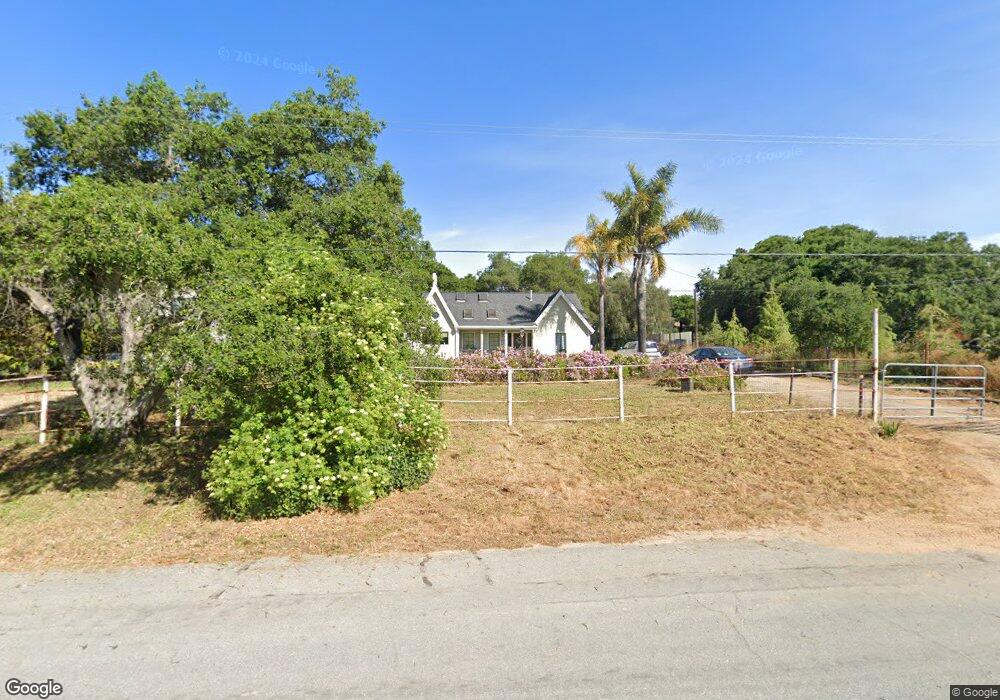
806 Inga Rd Nipomo, CA 93444
Estimated Value: $926,000 - $1,082,000
3
Beds
2
Baths
2,050
Sq Ft
$494/Sq Ft
Est. Value
About This Home
This home is located at 806 Inga Rd, Nipomo, CA 93444 and is currently estimated at $1,011,969, approximately $493 per square foot. 806 Inga Rd is a home located in San Luis Obispo County with nearby schools including Dana Elementary School, Mesa Middle School, and Nipomo High School.
Ownership History
Date
Name
Owned For
Owner Type
Purchase Details
Closed on
Oct 23, 2009
Sold by
Edwards Cindy J
Bought by
Edwards Cindy J
Current Estimated Value
Create a Home Valuation Report for This Property
The Home Valuation Report is an in-depth analysis detailing your home's value as well as a comparison with similar homes in the area
Home Values in the Area
Average Home Value in this Area
Purchase History
| Date | Buyer | Sale Price | Title Company |
|---|---|---|---|
| Edwards Cindy J | -- | None Available |
Source: Public Records
Tax History Compared to Growth
Tax History
| Year | Tax Paid | Tax Assessment Tax Assessment Total Assessment is a certain percentage of the fair market value that is determined by local assessors to be the total taxable value of land and additions on the property. | Land | Improvement |
|---|---|---|---|---|
| 2025 | $4,208 | $409,151 | $165,197 | $243,954 |
| 2024 | $4,160 | $401,129 | $161,958 | $239,171 |
| 2023 | $4,160 | $393,265 | $158,783 | $234,482 |
| 2022 | $4,097 | $385,555 | $155,670 | $229,885 |
| 2021 | $4,090 | $377,996 | $152,618 | $225,378 |
| 2020 | $4,043 | $374,122 | $151,054 | $223,068 |
| 2019 | $4,018 | $366,788 | $148,093 | $218,695 |
| 2018 | $3,971 | $359,597 | $145,190 | $214,407 |
| 2017 | $3,896 | $352,547 | $142,344 | $210,203 |
| 2016 | $3,675 | $345,635 | $139,553 | $206,082 |
| 2015 | $3,622 | $340,444 | $137,457 | $202,987 |
| 2014 | $3,488 | $333,776 | $134,765 | $199,011 |
Source: Public Records
Map
Nearby Homes
- 875 Camino Caballo
- 219 Lema Dr
- 1010 1012 Upper Los Berros Rd
- 217 Hope Way
- 228 Chaparral Ln
- 255 Encino Ln
- 620 Camino Roble
- 759 Viola Ct
- 615 Sweet Donna Place
- 719 W Tefft St
- 680 Hill St
- 160 San Antonio Ln
- Mesa Plan at Hill Street Terraces - Hill Street Series
- Pacific Plan at Hill Street Terraces - Hill Street Series
- Monarch Plan at Hill Street Terraces - Hill Street Series
- Rancho Plan at Hill Street Terraces - Hill Street Series
- Dana Plan at Hill Street Terraces - Hill Street Series
- 400 N Oakglen Ave
- 449 W Tefft St Unit 23
- 449 W Tefft St Unit 13