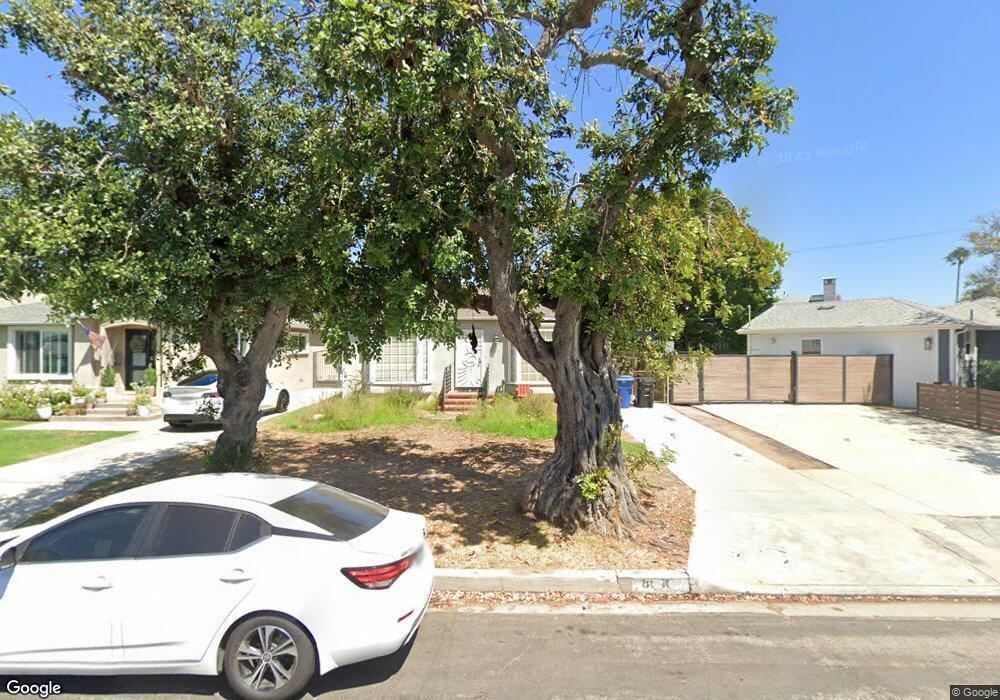
8060 Altavan Ave Los Angeles, CA 90045
Westchester NeighborhoodEstimated Value: $1,644,000 - $1,760,000
3
Beds
2
Baths
1,440
Sq Ft
$1,185/Sq Ft
Est. Value
About This Home
This home is located at 8060 Altavan Ave, Los Angeles, CA 90045 and is currently estimated at $1,706,144, approximately $1,184 per square foot. 8060 Altavan Ave is a home located in Los Angeles County with nearby schools including Loyola Village Elementary School, Wright Middle School STEAM Magnet, and Westchester Enriched Sciences Magnets.
Ownership History
Date
Name
Owned For
Owner Type
Purchase Details
Closed on
Sep 4, 2024
Sold by
Martin Marilyn
Bought by
Marilyn Martin Living Trust and Martin
Current Estimated Value
Purchase Details
Closed on
Jan 25, 2024
Sold by
George J And Evelyn M Martin 1981 Trust
Bought by
Martin Marilyn
Purchase Details
Closed on
Jan 11, 2024
Sold by
George J And Evelyn M Martin 1981 Trust
Bought by
Martin Marilyn
Purchase Details
Closed on
Apr 21, 2011
Sold by
Costello M Rita
Bought by
Martin Evelyn May and Geroge Joseph Martin & Evelyn May Martin
Purchase Details
Closed on
Sep 3, 1998
Sold by
Rabbat Shawki
Bought by
Costello M Rita
Home Financials for this Owner
Home Financials are based on the most recent Mortgage that was taken out on this home.
Original Mortgage
$208,000
Interest Rate
6.88%
Create a Home Valuation Report for This Property
The Home Valuation Report is an in-depth analysis detailing your home's value as well as a comparison with similar homes in the area
Home Values in the Area
Average Home Value in this Area
Purchase History
| Date | Buyer | Sale Price | Title Company |
|---|---|---|---|
| Marilyn Martin Living Trust | -- | None Listed On Document | |
| Martin Marilyn | -- | None Listed On Document | |
| Martin Marilyn | -- | None Listed On Document | |
| Martin Evelyn May | $679,000 | Fidelity National Title Co | |
| Costello M Rita | $333,000 | Fidelity National Title Ins |
Source: Public Records
Mortgage History
| Date | Status | Borrower | Loan Amount |
|---|---|---|---|
| Previous Owner | Costello M Rita | $208,000 |
Source: Public Records
Tax History Compared to Growth
Tax History
| Year | Tax Paid | Tax Assessment Tax Assessment Total Assessment is a certain percentage of the fair market value that is determined by local assessors to be the total taxable value of land and additions on the property. | Land | Improvement |
|---|---|---|---|---|
| 2025 | $15,266 | $1,271,856 | $963,364 | $308,492 |
| 2024 | $15,266 | $1,246,919 | $944,475 | $302,444 |
| 2023 | $10,339 | $836,128 | $634,057 | $202,071 |
| 2022 | $9,863 | $819,734 | $621,625 | $198,109 |
| 2021 | $9,740 | $803,662 | $609,437 | $194,225 |
| 2020 | $9,839 | $795,422 | $603,188 | $192,234 |
| 2019 | $9,451 | $779,826 | $591,361 | $188,465 |
| 2018 | $9,343 | $764,536 | $579,766 | $184,770 |
| 2016 | $8,936 | $734,851 | $557,254 | $177,597 |
| 2015 | $8,805 | $723,814 | $548,884 | $174,930 |
| 2014 | $8,838 | $709,637 | $538,133 | $171,504 |
Source: Public Records
Map
Nearby Homes
- 8057 Nardian Way
- 8301 Rayford Dr
- 7262 W 85th St
- 7346 W 83rd St
- 8136 Holy Cross Place
- 8309 Regis Way
- 7100 Playa Vista Dr Unit 120
- 7100 Playa Vista Dr Unit 406
- 7406 W 85th St
- 7000 W 85th St
- 13042 W North Icon Cir
- 7809 Mcconnell Ave
- 6400 Crescent Park E Unit 121
- 7538 W 82nd St
- 13044 Pacific Promenade Unit 308
- 12923 Bluff Creek Dr
- 6099 S Seabluff Dr
- 13200 Pacific Promenade Unit 420
- 7852 W 83rd St
- 7838 W 83rd St
- 8056 Altavan Ave
- 8064 Altavan Ave
- 8052 Altavan Ave
- 7215 W 83rd St
- 8046 Altavan Ave
- 8051 Nardian Way
- 8061 Nardian Way
- 8057 Altavan Ave
- 8042 Altavan Ave
- 8047 Nardian Way
- 7207 W 83rd St
- 8065 Nardian Way
- 8053 Altavan Ave
- 8043 Nardian Way
- 8047 Altavan Ave
- 8038 Altavan Ave
- 7232 W 83rd St
- 8039 Nardian Way
- 8300 Altavan Ave
- 8121 Fordham Rd