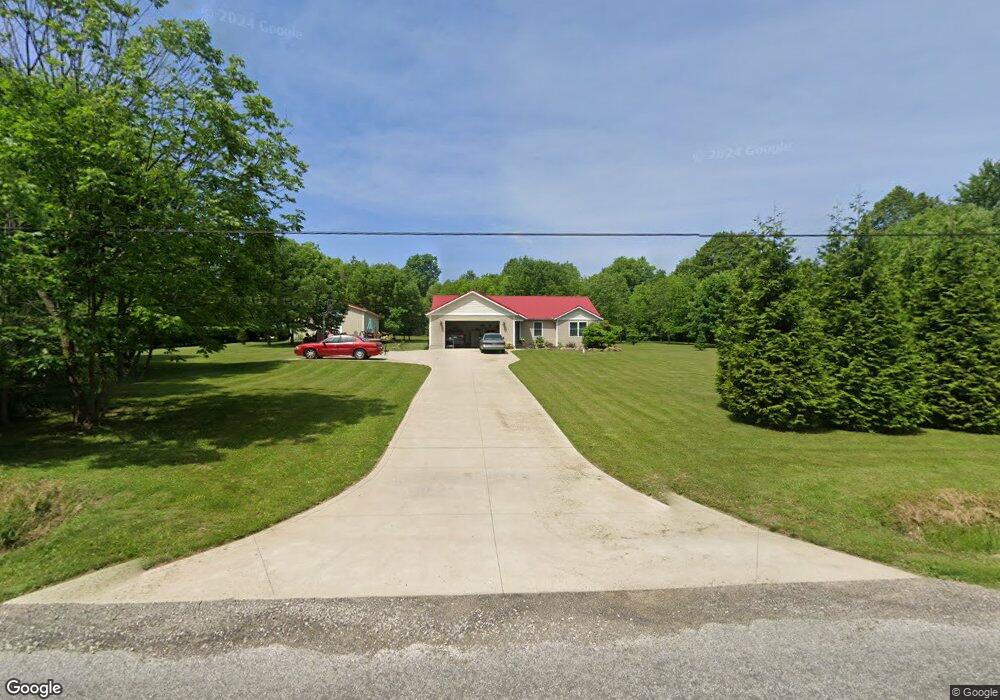
8076 Yoder Rd Seville, OH 44273
Estimated Value: $470,000 - $486,948
3
Beds
3
Baths
1,752
Sq Ft
$271/Sq Ft
Est. Value
About This Home
This home is located at 8076 Yoder Rd, Seville, OH 44273 and is currently estimated at $475,487, approximately $271 per square foot. 8076 Yoder Rd is a home with nearby schools including Valley View Elementary School, Central Intermediate School, and Wadsworth Middle School.
Ownership History
Date
Name
Owned For
Owner Type
Purchase Details
Closed on
Jun 22, 2022
Sold by
Resource Energy Llc
Bought by
Diversified Energy Llc
Current Estimated Value
Purchase Details
Closed on
Sep 5, 2017
Sold by
Newcomer Jerry D
Bought by
Newcomer Jerry D
Purchase Details
Closed on
Jul 22, 2017
Sold by
Newcomer Carl and Hilda L Newcomer Revocable Tru
Bought by
Newcomer Jerry D
Purchase Details
Closed on
Oct 30, 2014
Sold by
Willimack Ralph David
Bought by
Schismenos Paul M
Home Financials for this Owner
Home Financials are based on the most recent Mortgage that was taken out on this home.
Original Mortgage
$226,389
Interest Rate
4.23%
Mortgage Type
Future Advance Clause Open End Mortgage
Purchase Details
Closed on
Jun 18, 2001
Sold by
First Merit Bank Na
Bought by
Willimack Ralph David
Purchase Details
Closed on
Jun 5, 2001
Sold by
Graff Floyd C
Bought by
Willimack Ralph David
Create a Home Valuation Report for This Property
The Home Valuation Report is an in-depth analysis detailing your home's value as well as a comparison with similar homes in the area
Purchase History
| Date | Buyer | Sale Price | Title Company |
|---|---|---|---|
| Diversified Energy Llc | -- | None Listed On Document | |
| Diversified Energy Llc | -- | None Listed On Document | |
| Newcomer Jerry D | -- | None Available | |
| Newcomer Jerry D | $661,600 | None Available | |
| Schismenos Paul M | $45,900 | None Available | |
| Willimack Ralph David | $21,000 | -- | |
| Willimack Ralph David | $21,000 | -- |
Source: Public Records
Mortgage History
| Date | Status | Borrower | Loan Amount |
|---|---|---|---|
| Previous Owner | Schismenos Paul M | $226,389 |
Source: Public Records
Tax History
| Year | Tax Paid | Tax Assessment Tax Assessment Total Assessment is a certain percentage of the fair market value that is determined by local assessors to be the total taxable value of land and additions on the property. | Land | Improvement |
|---|---|---|---|---|
| 2024 | $5,779 | $134,810 | $36,260 | $98,550 |
| 2023 | $5,983 | $134,810 | $36,260 | $98,550 |
| 2022 | $6,016 | $134,810 | $36,260 | $98,550 |
| 2021 | $5,276 | $99,520 | $26,860 | $72,660 |
| 2020 | $4,791 | $99,520 | $26,860 | $72,660 |
| 2019 | $4,760 | $98,730 | $26,860 | $71,870 |
| 2018 | $4,223 | $81,920 | $24,930 | $56,990 |
| 2017 | $4,225 | $81,920 | $24,930 | $56,990 |
| 2016 | $4,051 | $77,030 | $24,930 | $52,100 |
| 2015 | $753 | $13,300 | $13,300 | $0 |
| 2014 | $754 | $13,300 | $13,300 | $0 |
| 2013 | $755 | $13,300 | $13,300 | $0 |
Source: Public Records
Map
Nearby Homes
- 3556 Blake Rd
- 4293 Good Rd
- 7500 Deerpath Trail
- 3269 Greenwich Rd
- 7014 River Styx Rd
- 6984 River Styx Rd
- 8421 Wadsworth Rd
- 2015 Osage Trail
- 6961 Bear Swamp Rd
- 4044 Hedgewood Dr
- 4702 Paradise Rd
- 4095 Watercourse Dr
- 4300 Poe Rd
- 144 Royal Crest Dr Unit M
- 866 Lawrence Dr
- 4186 Maidstone Ln
- 6445 Foxglove Dr
- 6470 Aberdeen Ln
- 6567 Torington Dr
- 6576 Torington Dr
Your Personal Tour Guide
Ask me questions while you tour the home.