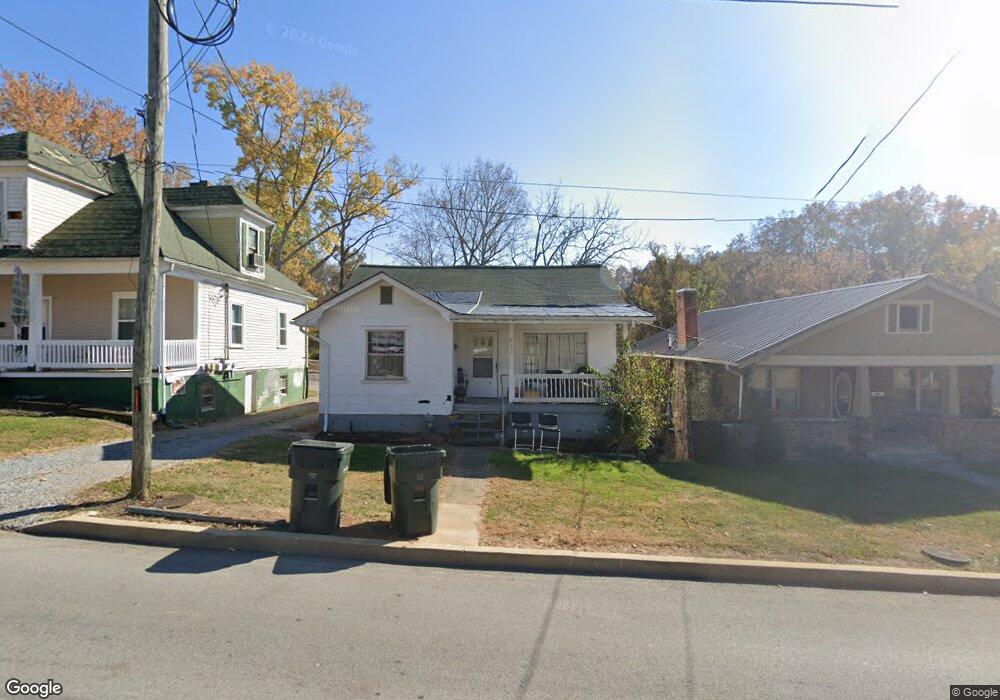
809 Carson St Unit 1 Greeneville, TN 37743
Estimated Value: $90,685 - $160,000
2
Beds
1
Bath
810
Sq Ft
$144/Sq Ft
Est. Value
About This Home
This home is located at 809 Carson St Unit 1, Greeneville, TN 37743 and is currently estimated at $116,421, approximately $143 per square foot. 809 Carson St Unit 1 is a home located in Greene County with nearby schools including Greeneville Middle School, Greeneville High School, and Greeneville Adventist Academy.
Ownership History
Date
Name
Owned For
Owner Type
Purchase Details
Closed on
Dec 1, 2010
Sold by
Lawing Vickie L
Bought by
Bird Alonzo J
Current Estimated Value
Purchase Details
Closed on
Mar 27, 2006
Sold by
Appalachian Community Fede
Bought by
Long Sharon J
Purchase Details
Closed on
Apr 1, 2005
Sold by
Gibson Frank D
Bought by
Appalachian Community Federal
Purchase Details
Closed on
Mar 12, 2002
Sold by
Greenbriar Llc
Bought by
Loos Kevin E
Home Financials for this Owner
Home Financials are based on the most recent Mortgage that was taken out on this home.
Original Mortgage
$25,200
Interest Rate
6.86%
Create a Home Valuation Report for This Property
The Home Valuation Report is an in-depth analysis detailing your home's value as well as a comparison with similar homes in the area
Home Values in the Area
Average Home Value in this Area
Purchase History
| Date | Buyer | Sale Price | Title Company |
|---|---|---|---|
| Bird Alonzo J | $28,000 | -- | |
| Long Sharon J | $36,000 | -- | |
| Appalachian Community Federal | $30,000 | -- | |
| Loos Kevin E | $31,500 | -- |
Source: Public Records
Mortgage History
| Date | Status | Borrower | Loan Amount |
|---|---|---|---|
| Previous Owner | Loos Kevin E | $25,200 |
Source: Public Records
Tax History Compared to Growth
Tax History
| Year | Tax Paid | Tax Assessment Tax Assessment Total Assessment is a certain percentage of the fair market value that is determined by local assessors to be the total taxable value of land and additions on the property. | Land | Improvement |
|---|---|---|---|---|
| 2025 | $460 | $14,025 | $3,650 | $10,375 |
| 2024 | $460 | $14,025 | $3,650 | $10,375 |
| 2023 | $524 | $14,025 | $0 | $0 |
| 2022 | $44,500 | $10,700 | $2,500 | $8,200 |
| 2021 | $445 | $10,700 | $2,500 | $8,200 |
| 2020 | $445 | $10,700 | $2,500 | $8,200 |
| 2019 | $445 | $10,700 | $2,500 | $8,200 |
| 2018 | $432 | $10,700 | $2,500 | $8,200 |
| 2017 | $353 | $8,875 | $2,500 | $6,375 |
| 2016 | $344 | $8,875 | $2,500 | $6,375 |
| 2015 | $344 | $8,875 | $2,500 | $6,375 |
| 2014 | $329 | $8,875 | $2,500 | $6,375 |
Source: Public Records
Map
Nearby Homes