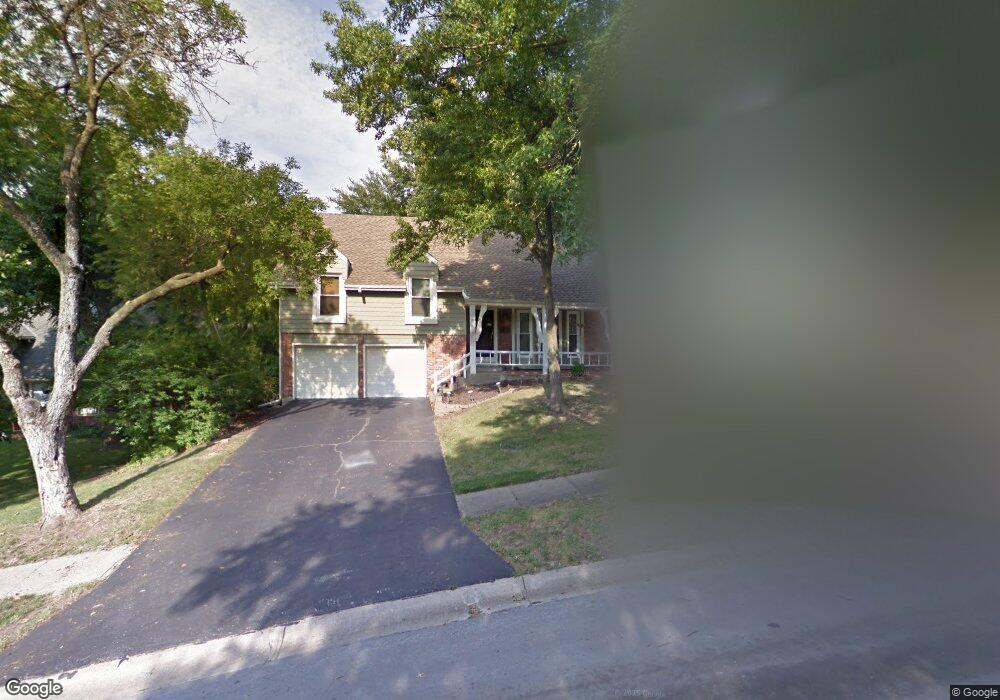
8107 Haskins St Lenexa, KS 66215
Estimated Value: $357,000 - $378,452
4
Beds
3
Baths
1,712
Sq Ft
$214/Sq Ft
Est. Value
About This Home
This home is located at 8107 Haskins St, Lenexa, KS 66215 and is currently estimated at $365,863, approximately $213 per square foot. 8107 Haskins St is a home located in Johnson County with nearby schools including Mill Creek Elementary School, Trailridge Middle School, and Shawnee Mission Northwest High School.
Ownership History
Date
Name
Owned For
Owner Type
Purchase Details
Closed on
Nov 11, 2013
Sold by
Anthony Kyle D and Anthony Rebecca S
Bought by
Anthony Kyle D and Anthony Rebecca S
Current Estimated Value
Purchase Details
Closed on
Nov 20, 2012
Sold by
Anthony Kyle D and Anthony Rebecca Slaton
Bought by
Anthony Kyle D and Anthony Rebecca Slaton
Home Financials for this Owner
Home Financials are based on the most recent Mortgage that was taken out on this home.
Original Mortgage
$152,000
Outstanding Balance
$22,079
Interest Rate
2.73%
Mortgage Type
New Conventional
Estimated Equity
$343,784
Purchase Details
Closed on
May 12, 2009
Sold by
Carlisle Carol C and Carol Carlisle C
Bought by
Anthony Kyle D and Slaton Rebecca
Home Financials for this Owner
Home Financials are based on the most recent Mortgage that was taken out on this home.
Original Mortgage
$160,500
Interest Rate
4.84%
Mortgage Type
Purchase Money Mortgage
Create a Home Valuation Report for This Property
The Home Valuation Report is an in-depth analysis detailing your home's value as well as a comparison with similar homes in the area
Home Values in the Area
Average Home Value in this Area
Purchase History
| Date | Buyer | Sale Price | Title Company |
|---|---|---|---|
| Anthony Kyle D | -- | None Available | |
| Anthony Kyle D | -- | None Available | |
| Anthony Kyle D | -- | First American Title Ins Co |
Source: Public Records
Mortgage History
| Date | Status | Borrower | Loan Amount |
|---|---|---|---|
| Open | Anthony Kyle D | $152,000 | |
| Closed | Anthony Kyle D | $160,500 |
Source: Public Records
Tax History
| Year | Tax Paid | Tax Assessment Tax Assessment Total Assessment is a certain percentage of the fair market value that is determined by local assessors to be the total taxable value of land and additions on the property. | Land | Improvement |
|---|---|---|---|---|
| 2025 | $4,192 | $37,605 | $7,764 | $29,841 |
| 2024 | $4,192 | $37,985 | $7,061 | $30,924 |
| 2023 | $3,800 | $33,730 | $7,061 | $26,669 |
| 2022 | $3,750 | $33,258 | $6,140 | $27,118 |
| 2021 | $3,440 | $28,876 | $5,851 | $23,025 |
| 2020 | $3,234 | $26,852 | $5,322 | $21,530 |
| 2019 | $2,953 | $24,472 | $4,630 | $19,842 |
| 2018 | $2,901 | $23,828 | $4,630 | $19,198 |
| 2017 | $2,845 | $22,643 | $4,204 | $18,439 |
| 2016 | $2,730 | $21,448 | $3,824 | $17,624 |
| 2015 | $2,575 | $20,355 | $3,824 | $16,531 |
| 2013 | -- | $18,619 | $3,824 | $14,795 |
Source: Public Records
Map
Nearby Homes
- 13511 W 82nd St
- 8014 Summit St
- 8221 Noland Rd
- 13720 W 83rd St
- 13212 W 84th St
- 8326 Richards Rd
- 8336 Rosehill Rd
- 8589 Hauser Ct
- 8505 Rosehill Rd
- 8135 Acuff Ln
- 7802 Westgate Dr
- 8266 Monrovia St
- 12548 W 82nd Terrace
- 8410 Greenwood Cir
- 12521 W 85th Terrace
- 7829 Caenen St
- 12212 W 79th Terrace
- 12209 W 79th Terrace
- 7950 Acuff Ln
- 12434 W 85th Terrace
- 8105 Haskins St
- 13402 W 82nd St
- 13308 W 82nd St
- 13306 W 82nd St
- 8104 Caenen Lake Rd
- 8103 Haskins St
- 13404 W 82nd St
- 8106 Caenen Lake Rd
- 8102 Caenen Lake Rd
- 8104 Haskins St
- 8100 Haskins St
- 13304 W 82nd St
- 8102 Haskins St
- 13406 W 82nd St
- 8100 Caenen Lake Rd
- 13401 W 82nd St
- 13309 W 82nd St
- 13405 W 82nd St
- 13307 W 82nd St
- 13305 W 82nd St
Your Personal Tour Guide
Ask me questions while you tour the home.