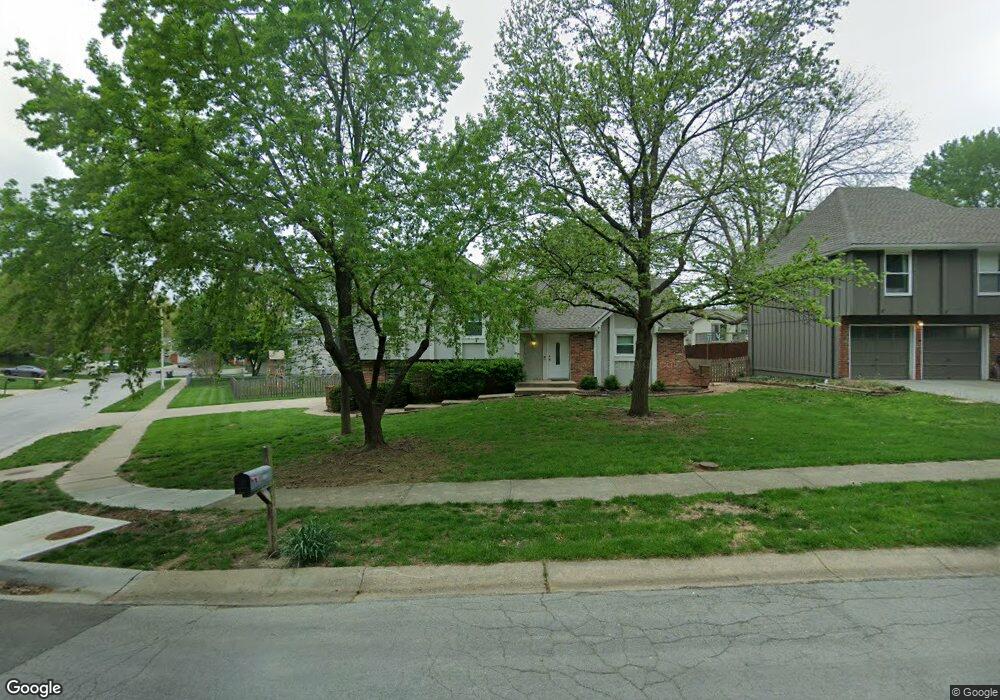
8110 Bradshaw St Lenexa, KS 66215
Estimated Value: $356,000 - $378,000
3
Beds
2
Baths
1,530
Sq Ft
$241/Sq Ft
Est. Value
About This Home
This home is located at 8110 Bradshaw St, Lenexa, KS 66215 and is currently estimated at $368,344, approximately $240 per square foot. 8110 Bradshaw St is a home located in Johnson County with nearby schools including Mill Creek Elementary School, Trailridge Middle School, and Shawnee Mission Northwest High School.
Ownership History
Date
Name
Owned For
Owner Type
Purchase Details
Closed on
Jan 14, 2008
Sold by
Hall Brian S and Hall Tonya J
Bought by
Wagner Cara and Wagner Joseph K
Current Estimated Value
Purchase Details
Closed on
Jul 20, 2004
Sold by
Spruyt Peter H and Spruyt Andera
Bought by
Hall Brian S and Hall Tonya J
Home Financials for this Owner
Home Financials are based on the most recent Mortgage that was taken out on this home.
Original Mortgage
$135,520
Interest Rate
5.75%
Mortgage Type
Purchase Money Mortgage
Purchase Details
Closed on
Feb 23, 2001
Sold by
Spruyt Wendy Jean
Bought by
Spruyt Peter Harry
Create a Home Valuation Report for This Property
The Home Valuation Report is an in-depth analysis detailing your home's value as well as a comparison with similar homes in the area
Home Values in the Area
Average Home Value in this Area
Purchase History
| Date | Buyer | Sale Price | Title Company |
|---|---|---|---|
| Wagner Cara | -- | Chicago Title Ins Co | |
| Hall Brian S | -- | Chicago Title Insurance Comp | |
| Spruyt Peter Harry | -- | -- |
Source: Public Records
Mortgage History
| Date | Status | Borrower | Loan Amount |
|---|---|---|---|
| Previous Owner | Hall Brian S | $135,520 | |
| Closed | Hall Brian S | $33,880 |
Source: Public Records
Tax History Compared to Growth
Tax History
| Year | Tax Paid | Tax Assessment Tax Assessment Total Assessment is a certain percentage of the fair market value that is determined by local assessors to be the total taxable value of land and additions on the property. | Land | Improvement |
|---|---|---|---|---|
| 2024 | $4,156 | $37,662 | $7,109 | $30,553 |
| 2023 | $3,964 | $35,190 | $7,109 | $28,081 |
| 2022 | $3,839 | $34,051 | $6,182 | $27,869 |
| 2021 | $3,636 | $30,556 | $5,893 | $24,663 |
| 2020 | $3,375 | $28,049 | $5,359 | $22,690 |
| 2019 | $3,094 | $25,668 | $4,663 | $21,005 |
| 2018 | $2,845 | $24,380 | $4,663 | $19,717 |
| 2017 | $2,959 | $23,575 | $4,234 | $19,341 |
| 2016 | $2,856 | $22,459 | $3,851 | $18,608 |
| 2015 | $2,723 | $21,551 | $3,851 | $17,700 |
| 2013 | -- | $19,607 | $3,851 | $15,756 |
Source: Public Records
Map
Nearby Homes
- 8011 Gillette St
- 7904 Rosehill Rd
- 7917 Westgate Dr
- 12808 W 82nd St
- 8215 Rosehill Rd
- 7818 Westgate Dr
- 7736 Westgate Dr
- 7805 Long Ave
- 12212 W 79th Terrace
- 12557 W 82nd Terrace
- 13136 W 84th St
- 13212 W 84th St
- 7913 Colony Ln
- 8277 Monrovia St
- 7514 Caenen Lake Rd
- 11926 W 82nd Terrace
- 11924 W 82nd Terrace
- 7526 Monrovia St
- 8545 Westgate St
- 7502 Monrovia St
- 8106 Bradshaw St
- 8105 Gillette St
- 8109 Gillette St
- 8101 Gillette St
- 12803 W 81st Terrace
- 8100 Bradshaw St
- 12801 W 81st Terrace
- 12807 W 81st Terrace
- 8111 Bradshaw St
- 8107 Bradshaw St
- 8013 Gillette St
- 8103 Bradshaw St
- 12811 W 81st Terrace
- 8006 Bradshaw St
- 8104 Parkhill St
- 8009 Bradshaw St
- 8104 Gillette St
- 8106 Parkhill St
- 8102 Gillette St
- 8102 Parkhill St