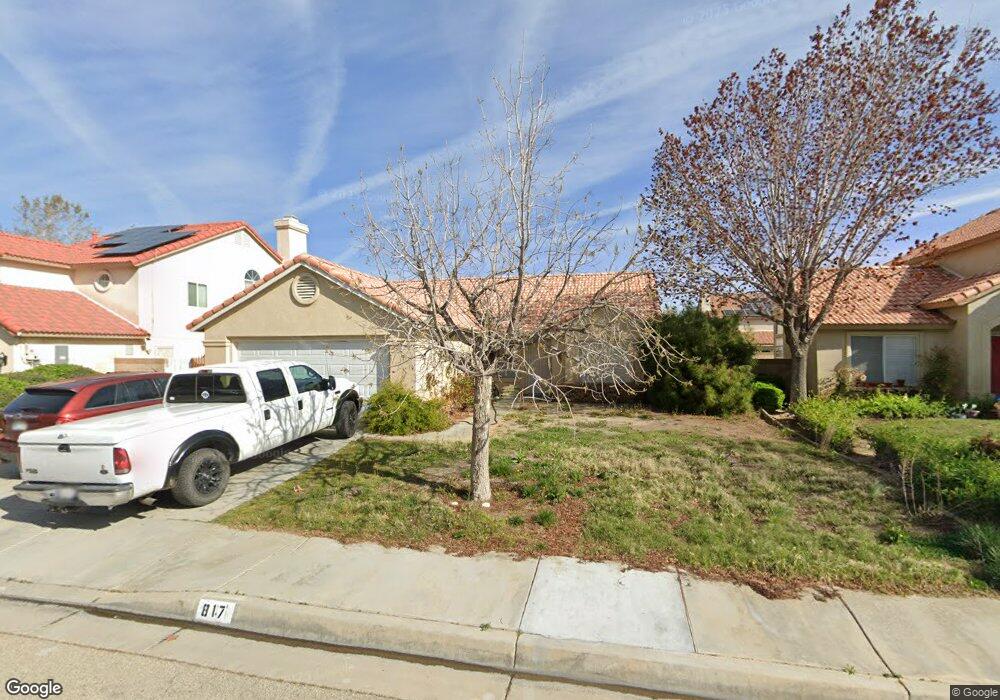
817 Cambridge Ct Lancaster, CA 93535
East Lancaster NeighborhoodEstimated Value: $421,000 - $455,000
3
Beds
2
Baths
1,446
Sq Ft
$303/Sq Ft
Est. Value
About This Home
This home is located at 817 Cambridge Ct, Lancaster, CA 93535 and is currently estimated at $438,700, approximately $303 per square foot. 817 Cambridge Ct is a home located in Los Angeles County with nearby schools including Jack Northrop Elementary School, New Vista Middle School, and Eastside High School.
Ownership History
Date
Name
Owned For
Owner Type
Purchase Details
Closed on
Nov 1, 2024
Sold by
Clear Recon Corp
Bought by
Mpsn Holdings No 1 Lp
Current Estimated Value
Purchase Details
Closed on
Nov 9, 2005
Sold by
Argo Clyde E and Argo Dolores J
Bought by
Argo Clyde E
Purchase Details
Closed on
Jan 6, 2000
Sold by
Hud
Bought by
Argo Clyde E
Home Financials for this Owner
Home Financials are based on the most recent Mortgage that was taken out on this home.
Original Mortgage
$51,000
Interest Rate
7.84%
Purchase Details
Closed on
Oct 4, 1999
Sold by
Countrywide Home Loans Inc
Bought by
Eastern Svgs Bank
Purchase Details
Closed on
Jul 21, 1999
Sold by
Eastern Svgs Bank
Bought by
Hud
Purchase Details
Closed on
Dec 28, 1998
Sold by
Haynes Charles
Bought by
Countrywide Home Loans Inc
Purchase Details
Closed on
Nov 3, 1994
Sold by
Trimark Development
Bought by
Haynes Charles
Home Financials for this Owner
Home Financials are based on the most recent Mortgage that was taken out on this home.
Original Mortgage
$104,243
Interest Rate
9.21%
Mortgage Type
FHA
Create a Home Valuation Report for This Property
The Home Valuation Report is an in-depth analysis detailing your home's value as well as a comparison with similar homes in the area
Home Values in the Area
Average Home Value in this Area
Purchase History
| Date | Buyer | Sale Price | Title Company |
|---|---|---|---|
| Mpsn Holdings No 1 Lp | $351,000 | -- | |
| Argo Clyde E | -- | -- | |
| Argo Clyde E | $86,000 | Fidelity Title | |
| Eastern Svgs Bank | -- | Landsafe Title | |
| Hud | -- | Landsafe Title | |
| Countrywide Home Loans Inc | $114,695 | Landsafe Title | |
| Haynes Charles | $105,500 | Continental Lawyers Title Co |
Source: Public Records
Mortgage History
| Date | Status | Borrower | Loan Amount |
|---|---|---|---|
| Previous Owner | Argo Clyde E | $51,000 | |
| Previous Owner | Haynes Charles | $104,243 |
Source: Public Records
Tax History
| Year | Tax Paid | Tax Assessment Tax Assessment Total Assessment is a certain percentage of the fair market value that is determined by local assessors to be the total taxable value of land and additions on the property. | Land | Improvement |
|---|---|---|---|---|
| 2025 | $2,877 | $447,000 | $111,700 | $335,300 |
| 2024 | $2,877 | $133,696 | $25,902 | $107,794 |
| 2023 | $2,821 | $131,076 | $25,395 | $105,681 |
| 2022 | $2,743 | $128,507 | $24,898 | $103,609 |
| 2021 | $2,363 | $125,988 | $24,410 | $101,578 |
| 2019 | $2,304 | $122,253 | $23,687 | $98,566 |
| 2018 | $2,265 | $119,857 | $23,223 | $96,634 |
| 2016 | $2,153 | $115,205 | $22,322 | $92,883 |
| 2015 | $2,129 | $113,475 | $21,987 | $91,488 |
| 2014 | $2,130 | $111,253 | $21,557 | $89,696 |
Source: Public Records
Map
Nearby Homes
- 751 Pino Ave
- 729 Whitlatch Dr
- 1021 Brianna Ave
- 43120 7th St E
- 637 E Avenue k4
- 43029 7th St E
- 43433 7th St E
- 43453 7th St E
- 43341 Elizabeth Ln
- 23000 E Avenue k12 Unit Vic
- 0 Challenger Wy Vic Ave Unit L 25006032
- 43428 6th St E
- 43010 Yaffa St
- 4 Melody Ln
- 1118 E Avenue K
- 0 Way
- 0 Ave L and 6th St E Unit 25008965
- 43415 Emilia Ln
- 0 7th St East @ J-14 Unit 26001768
- 0 Unit 25008816
- 823 Cambridge Ct
- 811 Cambridge Ct
- 818 E Avenue k7
- 812 E Avenue k7
- 829 Cambridge Ct
- 805 Cambridge Ct
- 824 E Avenue k7
- 806 E Avenue k7
- 830 E Avenue k7
- 816 Cambridge Ct
- 822 Cambridge Ct
- 835 Cambridge Ct
- 810 Cambridge Ct
- 828 Cambridge Ct
- 836 E Avenue k7
- 804 Cambridge Ct
- 841 Cambridge Ct
- 834 Cambridge Ct
- 780 E Avenue k7
- 0 Vic Ave K 7th Ste St Unit 22004176
Your Personal Tour Guide
Ask me questions while you tour the home.