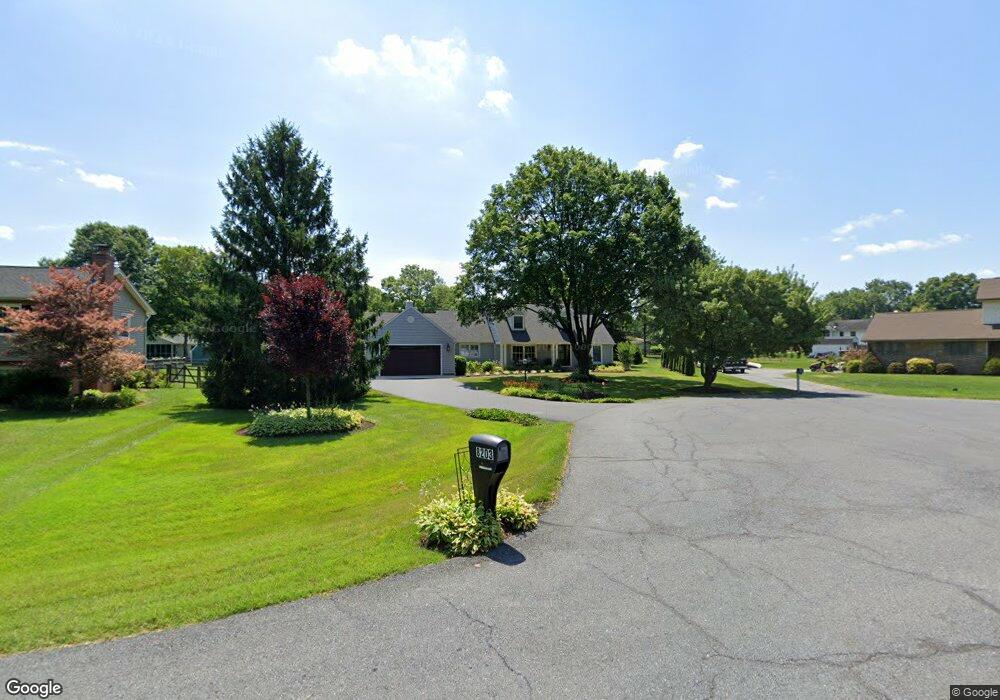
8203 Falstone Ct Frederick, MD 21702
Clover Hill NeighborhoodEstimated Value: $570,612 - $689,000
Studio
3
Baths
3,247
Sq Ft
$189/Sq Ft
Est. Value
About This Home
This home is located at 8203 Falstone Ct, Frederick, MD 21702 and is currently estimated at $615,153, approximately $189 per square foot. 8203 Falstone Ct is a home located in Frederick County with nearby schools including Yellow Springs Elementary School, Monocacy Middle School, and Gov. Thomas Johnson High School.
Ownership History
Date
Name
Owned For
Owner Type
Purchase Details
Closed on
Apr 30, 2019
Sold by
Rose Douglas R and Rose Louise V
Bought by
Igo Thomas E and Igo Kathleen E
Current Estimated Value
Home Financials for this Owner
Home Financials are based on the most recent Mortgage that was taken out on this home.
Original Mortgage
$377,580
Outstanding Balance
$330,545
Interest Rate
3.99%
Mortgage Type
Adjustable Rate Mortgage/ARM
Estimated Equity
$284,608
Purchase Details
Closed on
Jun 25, 1986
Sold by
Holmes Timothy H and Holmes Patricia
Bought by
Rose Douglas R and Rose Louise
Home Financials for this Owner
Home Financials are based on the most recent Mortgage that was taken out on this home.
Original Mortgage
$85,000
Interest Rate
10.61%
Purchase Details
Closed on
Jul 25, 1983
Sold by
Hechler Harold T and Hechler Linda L
Bought by
Holmes Timothy H and Holmes Patricia
Home Financials for this Owner
Home Financials are based on the most recent Mortgage that was taken out on this home.
Original Mortgage
$105,000
Interest Rate
13.58%
Create a Home Valuation Report for This Property
The Home Valuation Report is an in-depth analysis detailing your home's value as well as a comparison with similar homes in the area
Home Values in the Area
Average Home Value in this Area
Purchase History
| Date | Buyer | Sale Price | Title Company |
|---|---|---|---|
| Igo Thomas E | $420,000 | None Available | |
| Rose Douglas R | $143,200 | -- | |
| Holmes Timothy H | $128,500 | -- |
Source: Public Records
Mortgage History
| Date | Status | Borrower | Loan Amount |
|---|---|---|---|
| Open | Igo Thomas E | $377,580 | |
| Previous Owner | Rose Douglas R | $85,000 | |
| Previous Owner | Holmes Timothy H | $105,000 |
Source: Public Records
Tax History
| Year | Tax Paid | Tax Assessment Tax Assessment Total Assessment is a certain percentage of the fair market value that is determined by local assessors to be the total taxable value of land and additions on the property. | Land | Improvement |
|---|---|---|---|---|
| 2025 | $5,335 | $468,500 | -- | -- |
| 2024 | $5,335 | $433,300 | $0 | $0 |
| 2023 | $4,712 | $398,100 | $91,000 | $307,100 |
| 2022 | $4,448 | $375,433 | $0 | $0 |
| 2021 | $4,053 | $352,767 | $0 | $0 |
| 2020 | $3,922 | $330,100 | $91,000 | $239,100 |
| 2019 | $3,888 | $327,167 | $0 | $0 |
| 2018 | $3,557 | $303,467 | $0 | $0 |
| 2017 | $3,480 | $301,300 | $0 | $0 |
| 2016 | $4,255 | $292,100 | $0 | $0 |
| 2015 | $4,255 | $282,900 | $0 | $0 |
| 2014 | $4,255 | $273,700 | $0 | $0 |
Source: Public Records
Map
Nearby Homes
- 8201 Glendale Dr
- 8234 Glendale Dr
- 8104 Overlook Ct
- 8010 Glendale Dr
- 8321 Jordan Valley Way
- 8395 Buckeye Ct
- 6630 Fox Meade Ct
- 7951 Yellow Springs Rd
- 206 Blanca Ct
- 7903 Clover Hill Dr
- 1905 Antero Ct
- 1905 Wetterhorn Ct
- 1710 Trotter St
- 1920 Moran Dr
- 1922 Fauna Dr
- 1101 Spring Run Ct
- 1111 Spring Run Ct
- 1912 Moran Dr
- 2086 Pomona Way
- 2019 Tuscarora Valley Ct
- 8201 Falstone Ct
- 8205 Falstone Ct
- 8120 Overlook Dr
- 8118 Overlook Dr
- 8111 Clearfield Rd
- 8207 Falstone Ct
- 8122 Overlook Dr
- 8113 Clearfield Rd
- 8200 Falstone Ct
- 8202 Falstone Ct
- 8116 Overlook Dr
- 8204 Falstone Ct
- 6807 Falstone Dr
- 6811 Falstone Dr
- 8115 Clearfield Rd
- 8119 Overlook Dr
- 8117 Overlook Dr
- 6803 Falstone Dr
- 8109 Glendale Dr
- 8110 Clearfield Rd
Your Personal Tour Guide
Ask me questions while you tour the home.