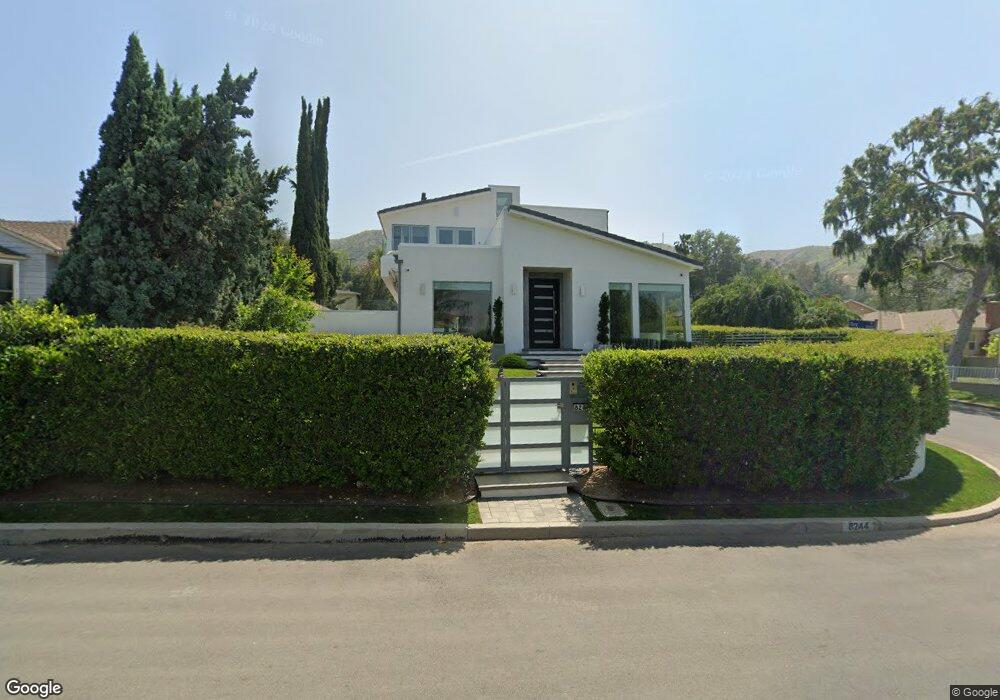
8244 Day St Sunland, CA 91040
Sunland NeighborhoodEstimated Value: $1,031,000 - $1,335,095
3
Beds
2
Baths
1,950
Sq Ft
$618/Sq Ft
Est. Value
About This Home
This home is located at 8244 Day St, Sunland, CA 91040 and is currently estimated at $1,205,024, approximately $617 per square foot. 8244 Day St is a home located in Los Angeles County with nearby schools including Apperson Street Elementary School, Mt. Gleason Middle School, and Verdugo Hills Senior High School.
Ownership History
Date
Name
Owned For
Owner Type
Purchase Details
Closed on
Sep 23, 2025
Sold by
Donabedian Chris Khajadour and Katrandzhyan Izabella
Bought by
Chris Khajadour Donabedian And Izabella Katra and Donabedian
Current Estimated Value
Purchase Details
Closed on
Mar 20, 2020
Sold by
Katrandzhyan Izabela and Donabedian Khajadour
Bought by
Donabedian Khajadour and Katrandzhyan Izabela
Home Financials for this Owner
Home Financials are based on the most recent Mortgage that was taken out on this home.
Original Mortgage
$700,000
Interest Rate
3.4%
Mortgage Type
New Conventional
Purchase Details
Closed on
Jul 16, 2007
Sold by
Kwon Choik and Kwon Jaeok
Bought by
Katrandzhyan Izabela
Home Financials for this Owner
Home Financials are based on the most recent Mortgage that was taken out on this home.
Original Mortgage
$496,000
Interest Rate
6.51%
Mortgage Type
New Conventional
Create a Home Valuation Report for This Property
The Home Valuation Report is an in-depth analysis detailing your home's value as well as a comparison with similar homes in the area
Home Values in the Area
Average Home Value in this Area
Purchase History
| Date | Buyer | Sale Price | Title Company |
|---|---|---|---|
| Chris Khajadour Donabedian And Izabella Katra | -- | None Listed On Document | |
| Donabedian Chris Khajadour | -- | None Listed On Document | |
| Donabedian Khajadour | -- | First American Title Company | |
| Katrandzhyan Izabela | $620,000 | Fidelity Van Nuys |
Source: Public Records
Mortgage History
| Date | Status | Borrower | Loan Amount |
|---|---|---|---|
| Previous Owner | Donabedian Khajadour | $700,000 | |
| Previous Owner | Katrandzhyan Izabela | $496,000 |
Source: Public Records
Tax History Compared to Growth
Tax History
| Year | Tax Paid | Tax Assessment Tax Assessment Total Assessment is a certain percentage of the fair market value that is determined by local assessors to be the total taxable value of land and additions on the property. | Land | Improvement |
|---|---|---|---|---|
| 2025 | $13,209 | $1,091,105 | $625,360 | $465,745 |
| 2024 | $13,209 | $1,069,712 | $613,099 | $456,613 |
| 2023 | $12,954 | $1,048,738 | $601,078 | $447,660 |
| 2022 | $12,082 | $1,005,000 | $566,000 | $439,000 |
| 2021 | $11,864 | $980,000 | $552,000 | $428,000 |
| 2020 | $11,143 | $899,990 | $506,600 | $393,390 |
| 2019 | $10,911 | $899,990 | $506,600 | $393,390 |
| 2018 | $11,023 | $899,990 | $506,600 | $393,390 |
| 2016 | $6,673 | $545,000 | $419,000 | $126,000 |
| 2015 | $6,138 | $500,000 | $384,000 | $116,000 |
| 2014 | $5,978 | $475,000 | $364,800 | $110,200 |
Source: Public Records
Map
Nearby Homes
- 10109 Parr Ave
- 10141 Scoville Ave
- 10250 Quill Ave
- 10227 Quill Ave
- 10335 Oro Vista Ave
- 10415 Mcvine Ave Unit 2
- 8455 Mcgroarty St
- 8352 Wyngate St
- 10429 Mcvine Ave
- 7961 Day St
- 10430 Mcvine Ave
- 7961 Apperson St
- 7951 Glenties Ln
- 8600 Day St
- 10300 Whitegate Ave
- 8421 Grenoble St
- 10414 Whitegate Ave
- 10347 Newhome Ave
- 10404 Jardine Ave
- 7755 Day St
- 8238 Day St
- 8232 Day St
- 10153 Parr Ave
- 8237 Cora St
- 10159 Parr Ave
- 8231 Cora St
- 10145 Parr Ave
- 8225 Cora St
- 8226 Day St
- 8243 Day St
- 0 Day St Unit F11018407
- 0 Day St Unit F12096251
- 0 Day St Unit SR14050082
- 0 Day St Unit 314031303
- 8235 Day St
- 10139 Parr Ave
- 10203 Parr Ave
- 8219 Cora St
- 8229 Day St
- 8220 Day St