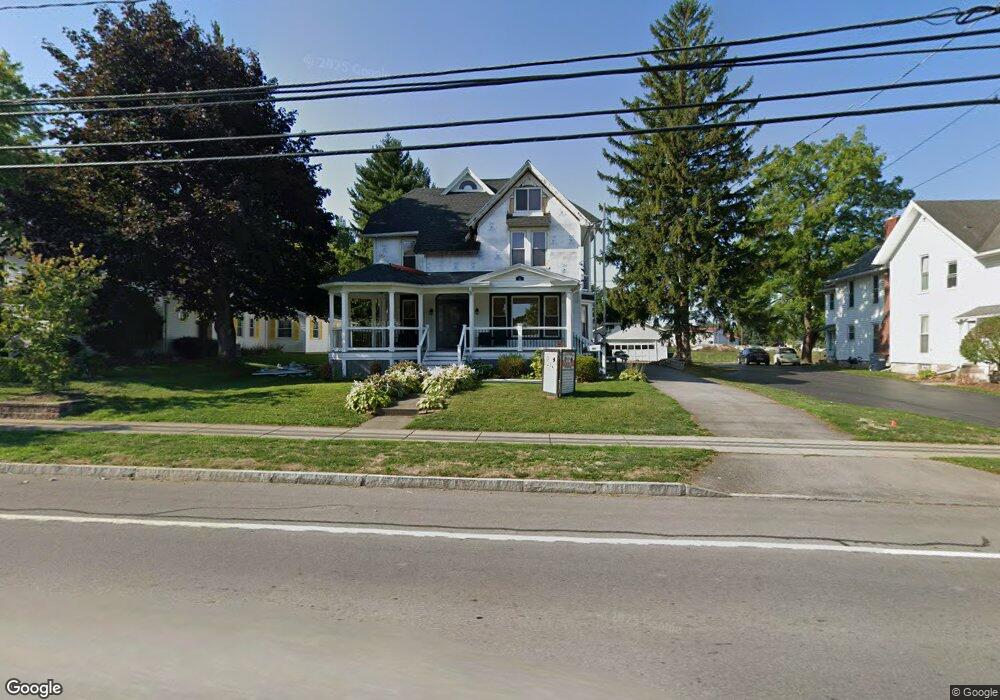
83 N Main St Oakfield, NY 14125
Estimated Value: $181,000 - $329,000
5
Beds
2
Baths
2,997
Sq Ft
$80/Sq Ft
Est. Value
About This Home
This home is located at 83 N Main St, Oakfield, NY 14125 and is currently estimated at $240,938, approximately $80 per square foot. 83 N Main St is a home located in Genesee County with nearby schools including Oakfield-Alabama Elementary School, Oakfield-Alabama Middle/High School, and Genesee Christian Academy.
Ownership History
Date
Name
Owned For
Owner Type
Purchase Details
Closed on
Dec 19, 2011
Sold by
Ognibene Stephen
Bought by
Sceusa Doreen
Current Estimated Value
Home Financials for this Owner
Home Financials are based on the most recent Mortgage that was taken out on this home.
Original Mortgage
$100,000
Outstanding Balance
$68,095
Interest Rate
4.01%
Mortgage Type
Purchase Money Mortgage
Estimated Equity
$172,843
Purchase Details
Closed on
Jun 30, 2009
Sold by
Ognibene Stephen
Bought by
Ognibene Stephen
Purchase Details
Closed on
Aug 8, 2002
Sold by
Betters Floyd
Bought by
Ognibene Stephen J
Create a Home Valuation Report for This Property
The Home Valuation Report is an in-depth analysis detailing your home's value as well as a comparison with similar homes in the area
Home Values in the Area
Average Home Value in this Area
Purchase History
| Date | Buyer | Sale Price | Title Company |
|---|---|---|---|
| Sceusa Doreen | $113,000 | John Gavenda | |
| Ognibene Stephen | -- | -- | |
| Ognibene Stephen J | $85,000 | Richard D. Yunker |
Source: Public Records
Mortgage History
| Date | Status | Borrower | Loan Amount |
|---|---|---|---|
| Open | Sceusa Doreen | $100,000 |
Source: Public Records
Tax History
| Year | Tax Paid | Tax Assessment Tax Assessment Total Assessment is a certain percentage of the fair market value that is determined by local assessors to be the total taxable value of land and additions on the property. | Land | Improvement |
|---|---|---|---|---|
| 2024 | $5,026 | $144,000 | $14,900 | $129,100 |
| 2023 | $5,018 | $139,000 | $14,900 | $124,100 |
| 2022 | $4,896 | $132,000 | $14,500 | $117,500 |
| 2021 | $4,899 | $125,000 | $14,500 | $110,500 |
| 2020 | $4,193 | $117,000 | $14,200 | $102,800 |
| 2019 | $4,067 | $115,000 | $14,200 | $100,800 |
| 2018 | $4,067 | $113,000 | $13,500 | $99,500 |
| 2017 | $4,038 | $113,000 | $13,500 | $99,500 |
| 2016 | $4,053 | $113,000 | $13,500 | $99,500 |
| 2015 | -- | $113,000 | $13,500 | $99,500 |
| 2014 | -- | $113,000 | $13,500 | $99,500 |
Source: Public Records
Map
Nearby Homes
- 18 Bennett Ave
- 34 Broadway St
- 42 Webber Ave
- 43 Garibaldi Ave
- 3538 Drake Street Rd
- 6632 Albion Rd
- 3751 Batavia Elba Townline Rd
- 3233 Rd Unit B
- 6440 Knowlesville Rd
- 2651 Pratt Rd
- 6242 Knowlesville Rd
- 0 0 Knowlesville Rd
- 3644 W Main Street Rd
- 28 Chapel St
- 4559 W Saile Dr
- 48 Redfield Pkwy
- 4416 S Bennett Heights
- 68 Oak St
- 23 Adams St
- 30 Prospect Ave
Your Personal Tour Guide
Ask me questions while you tour the home.