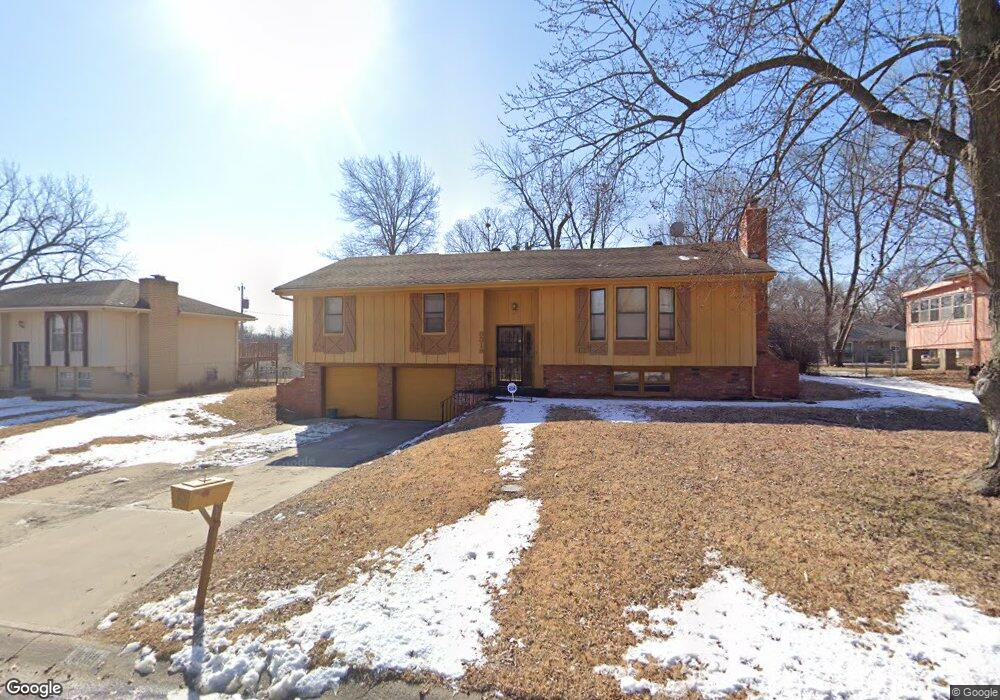
8319 E 49th St Kansas City, MO 64129
Eastwood Hills East NeighborhoodEstimated Value: $184,000 - $237,000
3
Beds
2
Baths
1,340
Sq Ft
$155/Sq Ft
Est. Value
About This Home
This home is located at 8319 E 49th St, Kansas City, MO 64129 and is currently estimated at $207,176, approximately $154 per square foot. 8319 E 49th St is a home located in Jackson County with nearby schools including Eastwood Hills Elementary, Raytown Middle School, and Raytown South High School.
Ownership History
Date
Name
Owned For
Owner Type
Purchase Details
Closed on
Aug 22, 2023
Sold by
Wilkinson Brad and Wilkinson Dione
Bought by
Bailey Latasha
Current Estimated Value
Home Financials for this Owner
Home Financials are based on the most recent Mortgage that was taken out on this home.
Original Mortgage
$8,225
Outstanding Balance
$1,761
Interest Rate
6.96%
Mortgage Type
New Conventional
Estimated Equity
$205,415
Purchase Details
Closed on
Jul 26, 2021
Sold by
Renee Allen Natalie
Bought by
Wilkinson Brad and Wilkinson Dione
Purchase Details
Closed on
Jun 12, 2020
Sold by
Allen Glenda B
Bought by
Allen Natalie Renee
Purchase Details
Closed on
Aug 28, 2001
Sold by
Allen Glenda B
Bought by
Williams Lois Nichole and Allen James Ronnell
Purchase Details
Closed on
Sep 21, 2000
Sold by
Allen Theodore
Bought by
Allen Glenda B
Create a Home Valuation Report for This Property
The Home Valuation Report is an in-depth analysis detailing your home's value as well as a comparison with similar homes in the area
Home Values in the Area
Average Home Value in this Area
Purchase History
| Date | Buyer | Sale Price | Title Company |
|---|---|---|---|
| Bailey Latasha | -- | Chicago Title | |
| Wilkinson Brad | -- | Chicago Title | |
| Allen Natalie Renee | -- | None Available | |
| Williams Lois Nichole | -- | Realty Title Company | |
| Allen Glenda B | -- | Realty Title Company |
Source: Public Records
Mortgage History
| Date | Status | Borrower | Loan Amount |
|---|---|---|---|
| Open | Bailey Latasha | $8,225 | |
| Open | Bailey Latasha | $230,743 |
Source: Public Records
Tax History Compared to Growth
Tax History
| Year | Tax Paid | Tax Assessment Tax Assessment Total Assessment is a certain percentage of the fair market value that is determined by local assessors to be the total taxable value of land and additions on the property. | Land | Improvement |
|---|---|---|---|---|
| 2025 | $2,179 | $25,629 | $2,360 | $23,269 |
| 2024 | $2,165 | $24,071 | $4,165 | $19,906 |
| 2023 | $2,165 | $24,071 | $2,785 | $21,286 |
| 2022 | $1,813 | $19,380 | $2,290 | $17,090 |
| 2021 | $1,813 | $19,380 | $2,290 | $17,090 |
| 2020 | $1,674 | $17,681 | $2,290 | $15,391 |
| 2019 | $1,642 | $17,681 | $2,290 | $15,391 |
| 2018 | $1,747 | $18,889 | $4,420 | $14,469 |
| 2017 | $1,692 | $18,889 | $4,420 | $14,469 |
| 2016 | $1,692 | $18,416 | $2,153 | $16,263 |
| 2014 | $1,648 | $17,879 | $2,090 | $15,789 |
Source: Public Records
Map
Nearby Homes
- 4881 Wallace Ave
- 4949 Laramie Ln
- 4958 Marsh Ave
- 5002 Skiles Ave
- 4701 Skiles Ave
- 5117 Booth Ave
- 5119 Booth Ave
- 5132 Skiles Ave
- 7605 Sni A Bar Terrace
- 7803 E 50th Terrace
- 4816 Blue Ridge Cutoff
- 4818 Blue Ridge Cutoff
- 5140 Booth Ave
- 8822 E 49th St
- 7700 E 48th Terrace
- 4812 Blue Ridge Cutoff
- 7615 E 48th St
- 7509 E 50th St
- 7504 E 49th St
- 8705 E 53rd Terrace
- 8313 E 49th St
- 8401 E 49th St
- 8400 E 49th Terrace
- 8406 E 49th Terrace
- 8312 E 49th Terrace
- 8307 E 49th St
- 8400 E 49th St
- 8407 E 49th St
- 8306 E 49th Terrace
- 8318 E 49th St
- 8312 E 49th St
- 8412 E 49th Terrace
- 8301 E 49th St
- 8406 E 49th St
- 8300 E 49th Terrace
- 8306 E 49th St
- 4906 Wallace Ave
- 8401 E 49th Terrace
- 8313 E 49th Terrace
- 8412 E 49th St