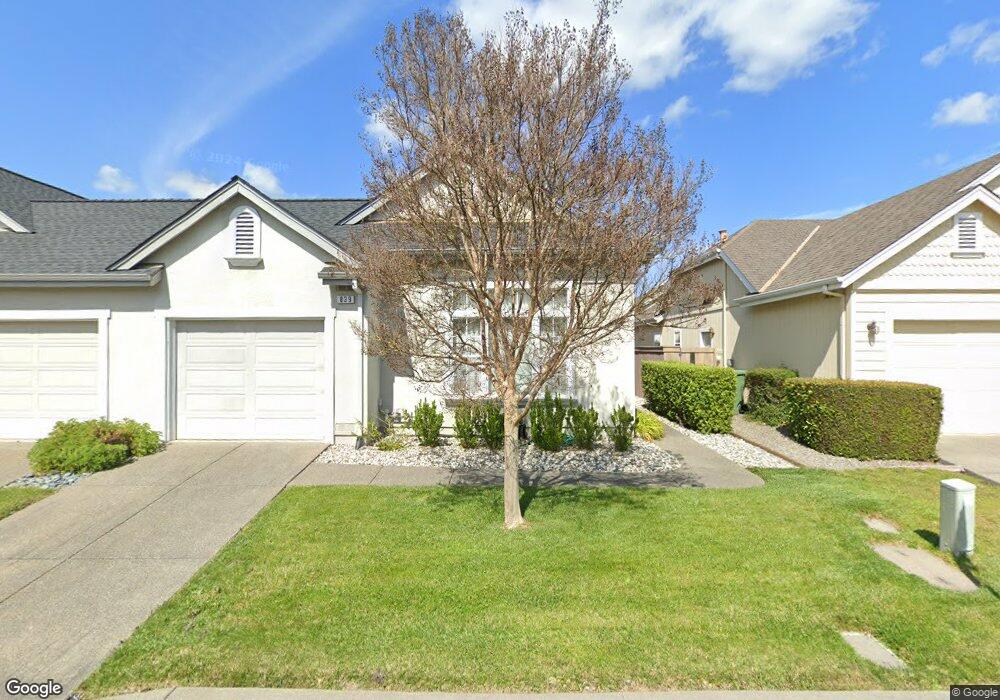
839 Cab Calloway Ct Windsor, CA 95492
Estimated Value: $627,227 - $675,000
2
Beds
2
Baths
1,212
Sq Ft
$537/Sq Ft
Est. Value
About This Home
This home is located at 839 Cab Calloway Ct, Windsor, CA 95492 and is currently estimated at $651,307, approximately $537 per square foot. 839 Cab Calloway Ct is a home located in Sonoma County with nearby schools including Brooks Elementary School, Mattie Washburn Elementary School, and Windsor Middle School.
Ownership History
Date
Name
Owned For
Owner Type
Purchase Details
Closed on
Sep 15, 2004
Sold by
Eschenhorst Frederick J and Eschenhorst Yvonne C
Bought by
Eschenhorst Yvonne C and Eschenhorst Fred J
Current Estimated Value
Purchase Details
Closed on
Nov 12, 1999
Sold by
Beckmann Kathleen
Bought by
Eschenhorst Frederick J and Eschenhorst Yvonne C
Purchase Details
Closed on
Oct 26, 1999
Sold by
Beckmann Michael and Beckmann Stephen E
Bought by
Beckmann Kathleen
Purchase Details
Closed on
Mar 13, 1998
Sold by
Cosgrove Mary T Revocable Trust and Jane Marlene
Bought by
Beckmann Michael and Beckmann Kathleen
Purchase Details
Closed on
Mar 12, 1998
Sold by
Beckmann Diane M
Bought by
Beckmann Stephen E
Purchase Details
Closed on
Jun 6, 1995
Sold by
Elsbree Ltd
Bought by
Cosgrove Mary T
Create a Home Valuation Report for This Property
The Home Valuation Report is an in-depth analysis detailing your home's value as well as a comparison with similar homes in the area
Home Values in the Area
Average Home Value in this Area
Purchase History
| Date | Buyer | Sale Price | Title Company |
|---|---|---|---|
| Eschenhorst Yvonne C | -- | -- | |
| Eschenhorst Frederick J | $210,000 | North American Title Co | |
| Beckmann Kathleen | -- | North Bay Title Co | |
| Beckmann Michael | $167,000 | North Bay Title Co | |
| Beckmann Stephen E | -- | North Bay Title | |
| Beckmann Michael | -- | North Bay Title Co | |
| Cosgrove Mary T | $170,000 | Chicago Title Company |
Source: Public Records
Tax History
| Year | Tax Paid | Tax Assessment Tax Assessment Total Assessment is a certain percentage of the fair market value that is determined by local assessors to be the total taxable value of land and additions on the property. | Land | Improvement |
|---|---|---|---|---|
| 2025 | $4,131 | $322,750 | $92,208 | $230,542 |
| 2024 | $4,131 | $316,422 | $90,400 | $226,022 |
| 2023 | $4,131 | $310,219 | $88,628 | $221,591 |
| 2022 | $3,992 | $304,138 | $86,891 | $217,247 |
| 2021 | $3,933 | $298,176 | $85,188 | $212,988 |
| 2020 | $4,011 | $295,120 | $84,315 | $210,805 |
| 2019 | $4,006 | $289,334 | $82,662 | $206,672 |
| 2018 | $3,952 | $283,662 | $81,042 | $202,620 |
| 2017 | $3,916 | $278,101 | $79,453 | $198,648 |
| 2016 | $3,696 | $272,649 | $77,896 | $194,753 |
| 2015 | $3,602 | $268,554 | $76,726 | $191,828 |
| 2014 | $3,551 | $263,295 | $75,224 | $188,071 |
Source: Public Records
Map
Nearby Homes
- 849 Patti Page Ct
- 864 Bob Crosby Way
- 9147 Benny Goodman Way
- 9131 Benny Goodman Way
- 9239 Lakewood Dr
- 9231 Lakewood Dr
- 100 Wooded Glen Ct
- 9551 Old Redwood Hwy
- 8185 Old Redwood Hwy
- 43 Johnson St
- 207 Othello Ct
- 9636 Lakewood Dr
- 327 Blazing Star Ct
- 1056 Esparto Ct
- 155 Amanda Way
- 159 Amanda Way
- 145 Amanda Way
- 149 Amanda Way
- 125 Johnson St
- 185 Johnson St
- 835 Cab Calloway Ct
- 848 Patti Page Ct
- 831 Cab Calloway Ct
- 768 Glen Miller Dr
- 852 Patti Page Ct
- 844 Patti Page Ct
- 838 Cab Calloway Ct
- 762 Glen Miller Dr
- 834 Cab Calloway Ct
- 842 Cab Calloway Ct
- 830 Cab Calloway Ct
- 856 Patti Page Ct
- 851 Cab Calloway Ct
- 840 Patti Page Ct
- 782 Glen Miller Dr
- 846 Cab Calloway Ct
- 860 Patti Page Ct
- 786 Glen Miller Dr
- 850 Cab Calloway Ct
- 790 Glen Miller Dr
Your Personal Tour Guide
Ask me questions while you tour the home.