843 Tramore Dr Stockbridge, GA 30281
Estimated payment $1,509/month
Highlights
- Traditional Architecture
- Patio
- Central Heating and Cooling System
- No HOA
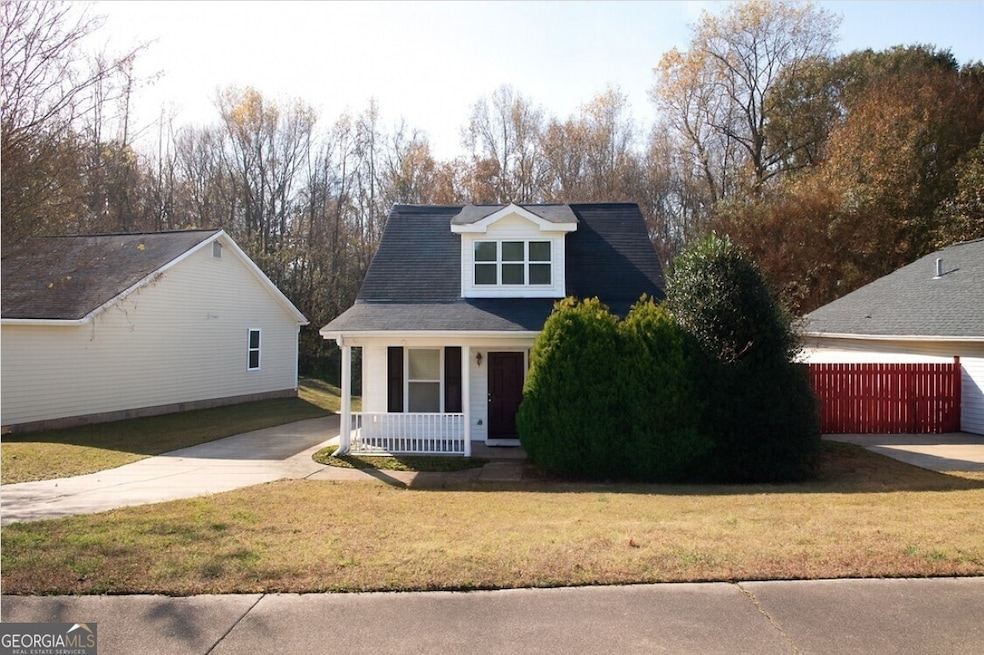
About This Home
Solid single-family opportunity in Stockbridge: this 3-bed, 2-bath home (approx. 1,218 sq ft; built 1998) presents a clean, functional floorplan with an open living area and practical kitchen. The property is tenant-occupied under an active lease, making it attractive for investors seeking immediate cashflow. Convenient to local retail, schools and commuter routes-priced and positioned for value.
Listing Agent
Tiana Artis
Redfin Corporation License #332543 Listed on: 11/21/2025

Co-Listing Agent
Sarita Evans
Redfin Corporation License #433674
Home Details
Home Type
- Single Family
Est. Annual Taxes
- $3,488
Year Built
- Built in 1998
Home Design
- Traditional Architecture
- Composition Roof
Interior Spaces
- 1,218 Sq Ft Home
- 2-Story Property
Bedrooms and Bathrooms
- 3 Main Level Bedrooms
- 2 Full Bathrooms
Parking
- 2 Parking Spaces
- Off-Street Parking
Schools
- Smith Barnes Elementary School
- Stockbridge Middle School
- Stockbridge High School
Additional Features
- Patio
- 5,663 Sq Ft Lot
- Central Heating and Cooling System
Community Details
- No Home Owners Association
- Glynn Addy Subdivision
Listing and Financial Details
- Legal Lot and Block 22 / A
Map
Home Values in the Area
Average Home Value in this Area
Tax History
| Year | Tax Paid | Tax Assessment Tax Assessment Total Assessment is a certain percentage of the fair market value that is determined by local assessors to be the total taxable value of land and additions on the property. | Land | Improvement |
|---|---|---|---|---|
| 2025 | $3,648 | $85,880 | $14,000 | $71,880 |
| 2024 | $3,648 | $81,280 | $14,000 | $67,280 |
| 2023 | $3,347 | $76,720 | $14,000 | $62,720 |
| 2022 | $2,239 | $52,400 | $6,655 | $45,745 |
| 2021 | $2,130 | $49,560 | $8,000 | $41,560 |
| 2020 | $2,016 | $46,560 | $7,822 | $38,738 |
| 2019 | $1,745 | $41,240 | $8,000 | $33,240 |
| 2018 | $1,554 | $36,240 | $8,000 | $28,240 |
| 2016 | $1,231 | $27,840 | $6,000 | $21,840 |
| 2015 | $1,057 | $22,600 | $6,000 | $16,600 |
| 2014 | $889 | $18,120 | $3,200 | $14,920 |
Property History
| Date | Event | Price | List to Sale | Price per Sq Ft |
|---|---|---|---|---|
| 11/21/2025 11/21/25 | For Sale | $230,600 | -- | $189 / Sq Ft |
Purchase History
| Date | Type | Sale Price | Title Company |
|---|---|---|---|
| Warranty Deed | $131,000 | -- | |
| Warranty Deed | $116,400 | -- | |
| Deed | -- | -- | |
| Foreclosure Deed | $85,086 | -- | |
| Deed | $77,900 | -- |
Mortgage History
| Date | Status | Loan Amount | Loan Type |
|---|---|---|---|
| Closed | $98,250 | Commercial | |
| Previous Owner | $77,883 | FHA |
Source: Georgia MLS
MLS Number: 10647955
APN: S20A-01-127-000
Disclaimer: Certain information contained herein is derived from information provided by parties other than Homes.com. All information provided is deemed reliable, but is not guaranteed to be accurate and should be independently verified.
![]() The data relating to real estate for sale on this web site comes in part from the Broker Reciprocity Program of Georgia MLS. Real estate listings held by brokerage firms other than Redfin are marked with the Broker Reciprocity logo and detailed information about them includes the name of the listing brokers. Information deemed reliable but not guaranteed. Copyright 2025 Georgia MLS. All rights reserved.
The data relating to real estate for sale on this web site comes in part from the Broker Reciprocity Program of Georgia MLS. Real estate listings held by brokerage firms other than Redfin are marked with the Broker Reciprocity logo and detailed information about them includes the name of the listing brokers. Information deemed reliable but not guaranteed. Copyright 2025 Georgia MLS. All rights reserved.
- 614 Tramore Ct
- 136 Glynn Addy Dr
- 323 Tramore Pass
- 0 Tye St Unit 10634748
- 0 Tye St Unit 20124844
- 155 Tye St
- 315 Breezy Hill Walk
- 200 Glynn Addy Dr Unit 5
- 32 Bay Cove Dr
- 44 Bay Cove Dr
- 184 Eagle Way
- 318 Eagle Ct
- 213 Baron Ct
- 235 Alexis Ave
- 118 Tye St
- 169 Misty Ridge Trail
- 513 McCain Creek Trail
- 500 McCain Creek Trail
- 9 Cheyenne Dr
- 4863 N Henry Blvd
- 869 Tramore Dr
- 312 Tramore Pass
- 164 Glynn Addy Dr
- 164 Glynn Addy Dr
- 800 Tramore Dr
- 156 Eagle Way
- 321 Eagle Way
- 38 Bay Cove Dr
- 117 Appleton Blvd
- 110 Fairhaven Ct
- 275 Eagle Way
- 705 Yukon Way
- 173 Brandon Ridge Cir
- 103 Appleton Blvd
- 207 Misty Ridge Trail
- 40 Carrera Rd
- 359 Tait Rd
- 210 Summer Hill Cir
- 122 Jackson Dr
- 700 Rock Quarry Rd