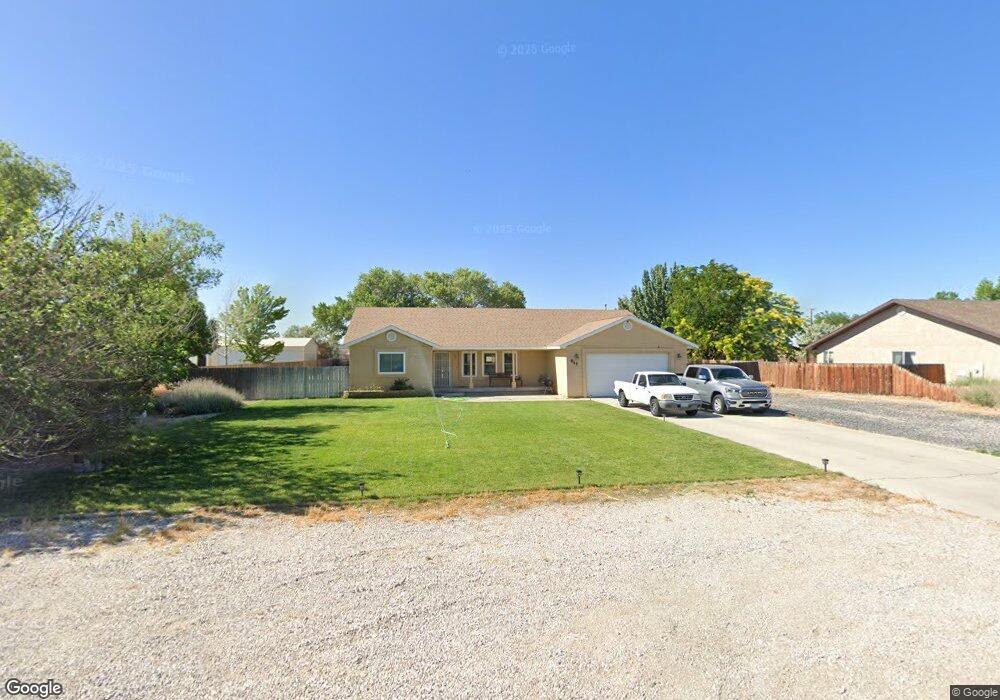
845 Hunter Park Way Fallon, NV 89406
Estimated Value: $469,429 - $575,000
3
Beds
2
Baths
1,730
Sq Ft
$297/Sq Ft
Est. Value
About This Home
This home is located at 845 Hunter Park Way, Fallon, NV 89406 and is currently estimated at $513,607, approximately $296 per square foot. 845 Hunter Park Way is a home located in Churchill County with nearby schools including Lahontan Elementary School, E.C. Best Elementary School, and Numa Elementary School.
Ownership History
Date
Name
Owned For
Owner Type
Purchase Details
Closed on
Oct 21, 2010
Sold by
Fannie Mae
Bought by
Crain Richard R and Crain Barbara J
Current Estimated Value
Home Financials for this Owner
Home Financials are based on the most recent Mortgage that was taken out on this home.
Original Mortgage
$128,169
Outstanding Balance
$84,060
Interest Rate
4.23%
Mortgage Type
FHA
Estimated Equity
$429,547
Purchase Details
Closed on
Jul 6, 2010
Sold by
Coll Richard K and Coll Donna
Bought by
Federal National Mortgage Association
Purchase Details
Closed on
Jan 2, 2008
Sold by
Coll Donna
Bought by
Coll Richard K
Purchase Details
Closed on
Mar 15, 2007
Sold by
Coll Donna and Wardwell Donna
Bought by
Coll Richard K and Coll Donna
Create a Home Valuation Report for This Property
The Home Valuation Report is an in-depth analysis detailing your home's value as well as a comparison with similar homes in the area
Purchase History
| Date | Buyer | Sale Price | Title Company |
|---|---|---|---|
| Crain Richard R | $141,000 | Northern Nevada Title Co | |
| Federal National Mortgage Association | $233,632 | First American National Defa | |
| Coll Richard K | -- | None Available | |
| Coll Richard K | -- | Stewart Title Company |
Source: Public Records
Mortgage History
| Date | Status | Borrower | Loan Amount |
|---|---|---|---|
| Open | Crain Richard R | $128,169 |
Source: Public Records
Tax History
| Year | Tax Paid | Tax Assessment Tax Assessment Total Assessment is a certain percentage of the fair market value that is determined by local assessors to be the total taxable value of land and additions on the property. | Land | Improvement |
|---|---|---|---|---|
| 2025 | $2,423 | $117,119 | $22,750 | $94,369 |
| 2024 | $2,423 | $117,952 | $22,750 | $95,202 |
| 2023 | $2,423 | $111,473 | $22,750 | $88,723 |
| 2022 | $2,285 | $90,795 | $14,000 | $76,795 |
| 2021 | $2,215 | $88,626 | $14,000 | $74,626 |
| 2020 | $2,123 | $84,313 | $14,000 | $70,313 |
| 2019 | $2,061 | $81,951 | $14,000 | $67,951 |
| 2018 | $2,001 | $80,192 | $14,000 | $66,192 |
| 2017 | $1,941 | $74,934 | $8,750 | $66,184 |
| 2016 | $1,893 | $69,108 | $8,750 | $60,358 |
| 2015 | $1,856 | $65,324 | $8,750 | $56,574 |
| 2014 | $1,807 | $54,963 | $8,750 | $46,213 |
Source: Public Records
Map
Nearby Homes
- 806 Karry Way
- 775 Karry Way
- 641 Megan Way
- 1060 Penelope Dr
- 530 Michael Dr
- 119 Toiyabe Ln
- 815 Great Basin Ln
- 1417 Ken Ln
- 800 Great Basin Ln
- 285 Amanda Ln
- 280 Hunter Park Way
- 882 Great Basin Ln
- 120 Hunter Park Way
- 1755 Coleman Rd
- 728 Keppel St
- 1492 Del Rio Dr
- 621 Keppel St
- 618 Keppel St
- 604 Keppel St
- 343 Crystal Ct
- 835 Hunter Park Way
- 868 Hunter Park Way
- 850 Hunter Park Way
- 805 Hunter Park Way
- 820 Hunter Park Way
- 726 Colorado Ln Unit Lot 1052
- 748 Colorado Ln
- 704 Colorado Ln Unit Lot 1053
- 777 Hunter Park Way
- 682 Colorado Ln Unit Lot 1054
- 756 Sunrise Terrace
- 936 Venturacci Ln
- 770 Colorado Ln
- 790 Colorado Ln Unit Lot 1049
- 660 Colorado Ln Unit Lot 1055
- 638 Colorado Ln
- 950 Venturacci Ln
- 765 Hunter Park Way
- 616 Colorado Ln Unit Lot 1057
- 734 Sunrise Terrace
Your Personal Tour Guide
Ask me questions while you tour the home.