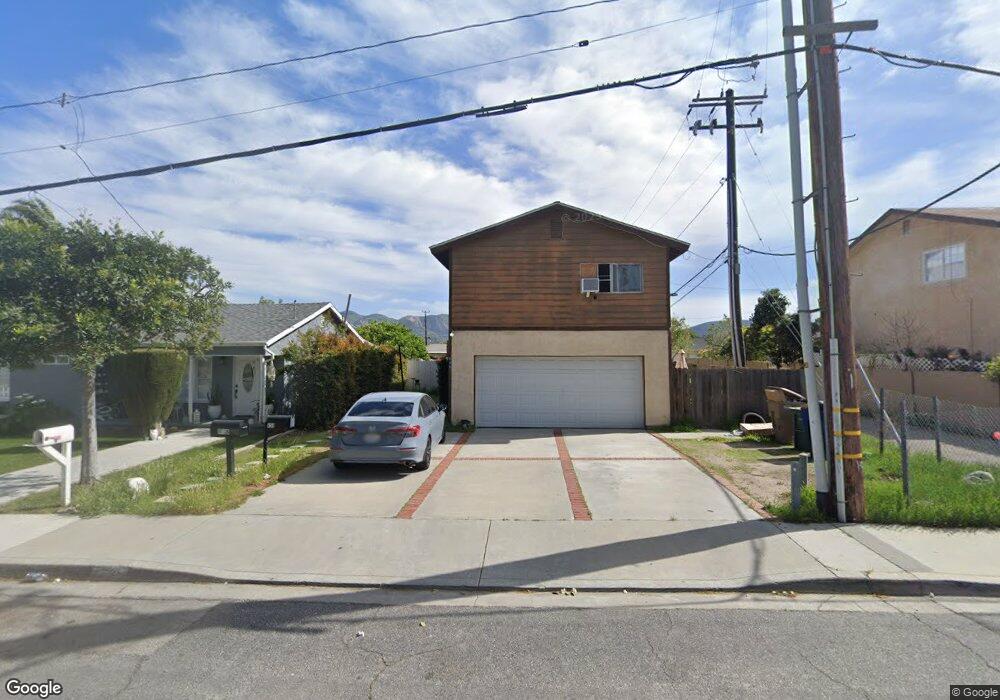
848 5th St Fillmore, CA 93015
Estimated Value: $635,597 - $692,000
Studio
--
Bath
1,704
Sq Ft
$391/Sq Ft
Est. Value
About This Home
This home is located at 848 5th St, Fillmore, CA 93015 and is currently estimated at $666,899, approximately $391 per square foot. 848 5th St is a home located in Ventura County with nearby schools including Fillmore Senior High.
Ownership History
Date
Name
Owned For
Owner Type
Purchase Details
Closed on
Jul 7, 2011
Sold by
Downs Evelia
Bought by
Downs Evelia
Current Estimated Value
Home Financials for this Owner
Home Financials are based on the most recent Mortgage that was taken out on this home.
Original Mortgage
$119,565
Outstanding Balance
$82,516
Interest Rate
4.73%
Mortgage Type
New Conventional
Estimated Equity
$584,383
Purchase Details
Closed on
May 24, 2011
Sold by
Downs Evelia
Bought by
Downs Evelia
Home Financials for this Owner
Home Financials are based on the most recent Mortgage that was taken out on this home.
Original Mortgage
$119,565
Outstanding Balance
$82,516
Interest Rate
4.73%
Mortgage Type
New Conventional
Estimated Equity
$584,383
Purchase Details
Closed on
Apr 26, 2002
Sold by
Downs Evelia
Bought by
Downs Evelia
Purchase Details
Closed on
Jul 1, 1994
Sold by
Hardy Jane Marie
Bought by
Downs Bill and Downs Evelia
Home Financials for this Owner
Home Financials are based on the most recent Mortgage that was taken out on this home.
Original Mortgage
$135,000
Interest Rate
8.37%
Mortgage Type
Purchase Money Mortgage
Create a Home Valuation Report for This Property
The Home Valuation Report is an in-depth analysis detailing your home's value as well as a comparison with similar homes in the area
Home Values in the Area
Average Home Value in this Area
Purchase History
| Date | Buyer | Sale Price | Title Company |
|---|---|---|---|
| Downs Evelia | -- | None Available | |
| Downs Evelia | -- | Servicelink | |
| Downs Evelia | -- | American Title Co | |
| Downs Bill | $150,000 | Lincoln Title Company | |
| Hardy Jane Marie | -- | Lincoln Title Company |
Source: Public Records
Mortgage History
| Date | Status | Borrower | Loan Amount |
|---|---|---|---|
| Open | Downs Evelia | $119,565 | |
| Previous Owner | Downs Bill | $135,000 |
Source: Public Records
Tax History
| Year | Tax Paid | Tax Assessment Tax Assessment Total Assessment is a certain percentage of the fair market value that is determined by local assessors to be the total taxable value of land and additions on the property. | Land | Improvement |
|---|---|---|---|---|
| 2025 | $2,827 | $251,910 | $134,354 | $117,556 |
| 2024 | $2,827 | $246,971 | $131,720 | $115,251 |
| 2023 | $2,789 | $242,129 | $129,137 | $112,992 |
| 2022 | $2,581 | $237,382 | $126,605 | $110,777 |
| 2021 | $2,932 | $232,728 | $124,123 | $108,605 |
| 2020 | $2,722 | $230,344 | $122,851 | $107,493 |
| 2019 | $2,730 | $225,829 | $120,443 | $105,386 |
| 2018 | $2,675 | $221,402 | $118,082 | $103,320 |
| 2017 | $2,691 | $217,062 | $115,767 | $101,295 |
| 2016 | $2,493 | $212,807 | $113,498 | $99,309 |
| 2015 | $2,426 | $209,613 | $111,795 | $97,818 |
| 2014 | $2,424 | $205,508 | $109,606 | $95,902 |
Source: Public Records
Map
Nearby Homes
- 831 Blaine Ave
- 949 Blaine Ave
- 815 Woodgrove Rd
- 809 Woodgrove Rd
- 600 C St
- 345 Blaine Ave
- 1106 Mockingbird Ln
- 639 Mountain View St
- 404 Central Ave
- 313 C St
- 1560 Goodenough Rd
- 318 Bard St
- 340 Central Ave
- 1262 Sespe Ave
- 616 Island View St
- 320 D St
- 1163 W Ventura St
- 1172 Oak Ave
- 228 Parkhaven Ct
- 578 Apricot Ln
Your Personal Tour Guide
Ask me questions while you tour the home.