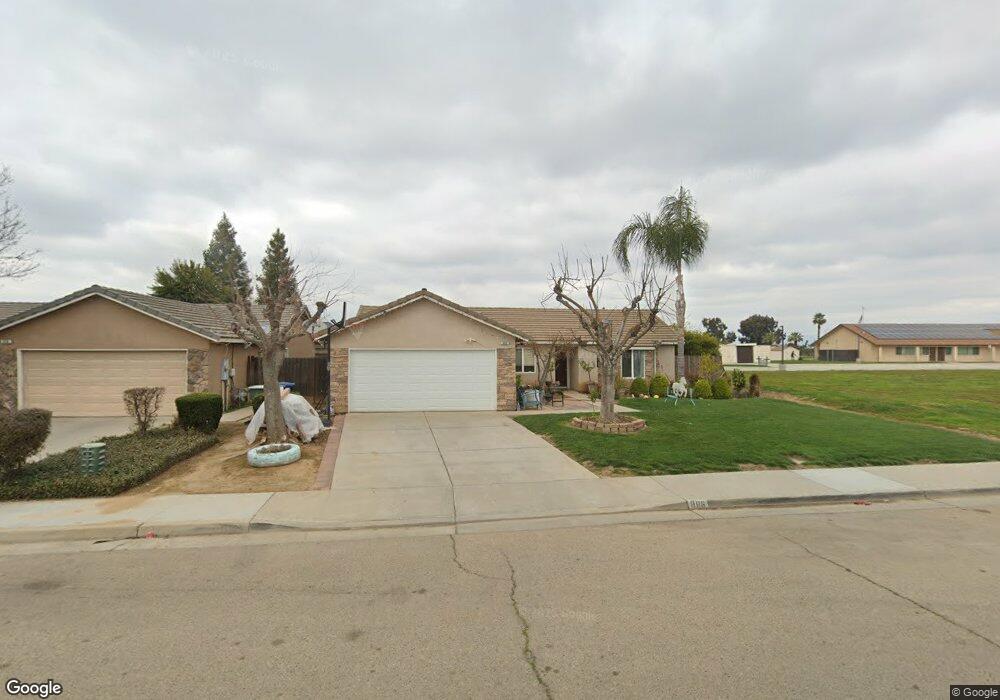
866 3rd St Sanger, CA 93657
Estimated Value: $325,332 - $382,000
3
Beds
2
Baths
1,300
Sq Ft
$268/Sq Ft
Est. Value
About This Home
This home is located at 866 3rd St, Sanger, CA 93657 and is currently estimated at $348,777, approximately $268 per square foot. 866 3rd St is a home located in Fresno County with nearby schools including Wilson Elementary School, Washington Academic Middle School, and Sanger High School.
Ownership History
Date
Name
Owned For
Owner Type
Purchase Details
Closed on
Jun 1, 2015
Sold by
Chronister Cora M
Bought by
Yoder Derek K and Yoder Janice K
Current Estimated Value
Purchase Details
Closed on
Jul 31, 2008
Sold by
Yoder Derek K and Yoder Janice K
Bought by
Yoder Derek K and Yoder Janice K
Purchase Details
Closed on
Jun 3, 2005
Sold by
Chronister Cora M
Bought by
Yoder Derek K and Yoder Janice K
Home Financials for this Owner
Home Financials are based on the most recent Mortgage that was taken out on this home.
Original Mortgage
$130,800
Interest Rate
5.72%
Mortgage Type
Fannie Mae Freddie Mac
Purchase Details
Closed on
May 27, 2005
Sold by
Allen Homes Inc
Bought by
Chronister Cora M
Home Financials for this Owner
Home Financials are based on the most recent Mortgage that was taken out on this home.
Original Mortgage
$130,800
Interest Rate
5.72%
Mortgage Type
Fannie Mae Freddie Mac
Create a Home Valuation Report for This Property
The Home Valuation Report is an in-depth analysis detailing your home's value as well as a comparison with similar homes in the area
Home Values in the Area
Average Home Value in this Area
Purchase History
| Date | Buyer | Sale Price | Title Company |
|---|---|---|---|
| Yoder Derek K | -- | None Available | |
| Yoder Derek K | -- | None Available | |
| Yoder Derek K | -- | First American Title Ins Co | |
| Chronister Cora M | $163,500 | First American Title Ins Co |
Source: Public Records
Mortgage History
| Date | Status | Borrower | Loan Amount |
|---|---|---|---|
| Previous Owner | Chronister Cora M | $130,800 |
Source: Public Records
Tax History
| Year | Tax Paid | Tax Assessment Tax Assessment Total Assessment is a certain percentage of the fair market value that is determined by local assessors to be the total taxable value of land and additions on the property. | Land | Improvement |
|---|---|---|---|---|
| 2025 | $2,955 | $225,652 | $69,004 | $156,648 |
| 2023 | $2,772 | $216,891 | $66,325 | $150,566 |
| 2022 | $2,732 | $212,639 | $65,025 | $147,614 |
| 2021 | $2,372 | $187,400 | $37,400 | $150,000 |
| 2020 | $2,305 | $185,600 | $37,100 | $148,500 |
| 2019 | $2,259 | $182,000 | $36,400 | $145,600 |
| 2018 | $2,167 | $178,500 | $35,700 | $142,800 |
| 2017 | $2,130 | $175,000 | $35,000 | $140,000 |
| 2016 | $1,699 | $145,000 | $30,000 | $115,000 |
| 2015 | $1,333 | $110,400 | $33,700 | $76,700 |
| 2014 | -- | $103,500 | $31,600 | $71,900 |
Source: Public Records
Map
Nearby Homes
Your Personal Tour Guide
Ask me questions while you tour the home.