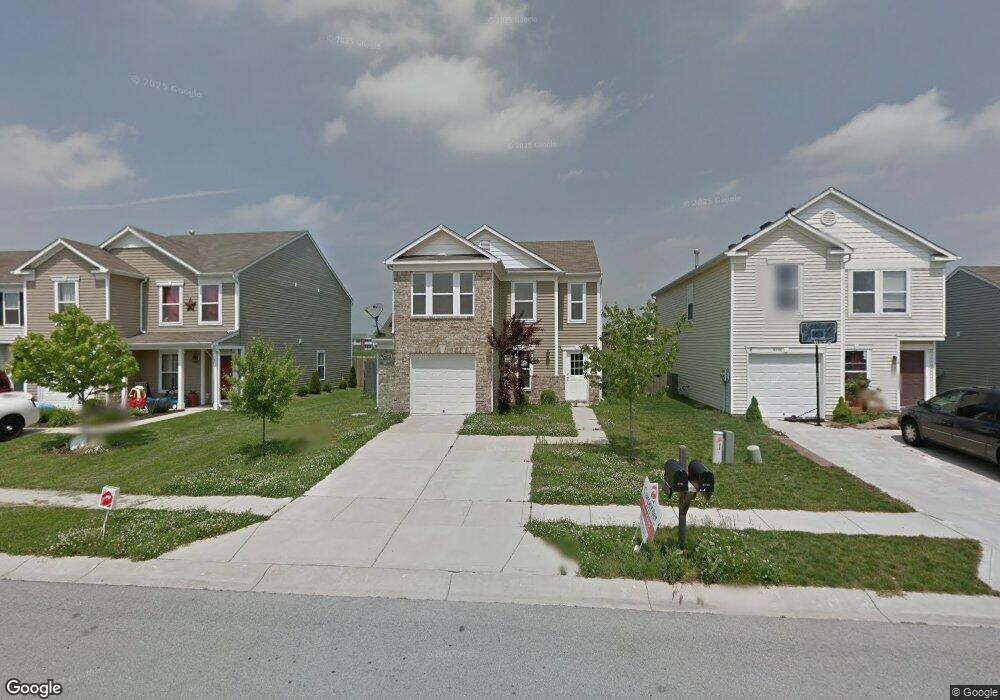
8710 Hosta Way Camby, IN 46113
Camby NeighborhoodEstimated Value: $222,000 - $235,000
3
Beds
3
Baths
1,588
Sq Ft
$143/Sq Ft
Est. Value
About This Home
This home is located at 8710 Hosta Way, Camby, IN 46113 and is currently estimated at $227,803, approximately $143 per square foot. 8710 Hosta Way is a home located in Marion County with nearby schools including West Newton Elementary School, Decatur Middle School, and Decatur Central High School.
Ownership History
Date
Name
Owned For
Owner Type
Purchase Details
Closed on
Aug 18, 2016
Sold by
Secretary Of Housing & Urban Development
Bought by
Franco Jorge E
Current Estimated Value
Home Financials for this Owner
Home Financials are based on the most recent Mortgage that was taken out on this home.
Original Mortgage
$81,816
Outstanding Balance
$64,323
Interest Rate
3.45%
Mortgage Type
FHA
Estimated Equity
$163,480
Purchase Details
Closed on
Jul 21, 2015
Sold by
Bank Of America Na
Bought by
The Secretary Of Housing & Urban Develop
Purchase Details
Closed on
Jul 15, 2015
Sold by
Campbell Libby L and Springman Brooke N
Bought by
Bank Of America Na
Purchase Details
Closed on
Oct 20, 2006
Sold by
C P Morgan Communities Lp
Bought by
Springman Brooke N and Campbell Libby L
Home Financials for this Owner
Home Financials are based on the most recent Mortgage that was taken out on this home.
Original Mortgage
$112,462
Interest Rate
6.5%
Mortgage Type
FHA
Create a Home Valuation Report for This Property
The Home Valuation Report is an in-depth analysis detailing your home's value as well as a comparison with similar homes in the area
Home Values in the Area
Average Home Value in this Area
Purchase History
We collect this data history from publicly available records. To have your information removed, we recommend requesting removal directly through your county’s website.
| Date | Buyer | Sale Price | Title Company |
|---|---|---|---|
| Franco Jorge E | -- | Mtc | |
| The Secretary Of Housing & Urban Develop | -- | None Available | |
| Bank Of America Na | $176,967 | Attorney | |
| Springman Brooke N | -- | None Available |
Source: Public Records
Mortgage History
We collect this data history from publicly available records. To have your information removed, we recommend requesting removal directly through your county’s website.
| Date | Status | Borrower | Loan Amount |
|---|---|---|---|
| Open | Franco Jorge E | $81,816 | |
| Previous Owner | Springman Brooke N | $112,462 |
Source: Public Records
Tax History
| Year | Tax Paid | Tax Assessment Tax Assessment Total Assessment is a certain percentage of the fair market value that is determined by local assessors to be the total taxable value of land and additions on the property. | Land | Improvement |
|---|---|---|---|---|
| 2025 | $2,241 | $195,400 | $17,800 | $177,600 |
| 2024 | $2,131 | $201,600 | $17,800 | $183,800 |
| 2023 | $2,131 | $186,800 | $17,800 | $169,000 |
| 2022 | $2,022 | $174,000 | $17,800 | $156,200 |
| 2021 | $1,732 | $148,000 | $17,800 | $130,200 |
| 2020 | $1,493 | $134,300 | $17,800 | $116,500 |
| 2019 | $1,473 | $126,400 | $17,800 | $108,600 |
| 2018 | $1,436 | $124,500 | $17,800 | $106,700 |
| 2017 | $1,219 | $105,500 | $17,800 | $87,700 |
| 2016 | $1,215 | $105,400 | $17,800 | $87,600 |
| 2014 | $2,390 | $105,300 | $17,800 | $87,500 |
| 2013 | $2,040 | $102,000 | $17,800 | $84,200 |
Source: Public Records
Map
Nearby Homes
- 8748 Hosta Way
- 8848 Hosta Way
- 9004 Noble Heights Ln
- 9022 Noble Heights Ln
- 9028 Noble Heights Ln
- 8819 Dingley Rd
- 8837 Dingley Rd
- 8825 Dingley Rd
- 8831 Dingley Rd
- 9054 Noble Heights Ln
- 9036 Noble Heights Ln
- 9048 Noble Heights Ln
- 8804 Boot St
- 7518 Firecrest Ln
- 7514 Firecrest Ln
- 7510 Firecrest Ln
- 8713 Comstock Ct
- 7917 Hosta Dr
- 8719 Hollander Dr
- 7618 Bolero Dr
Your Personal Tour Guide
Ask me questions while you tour the home.