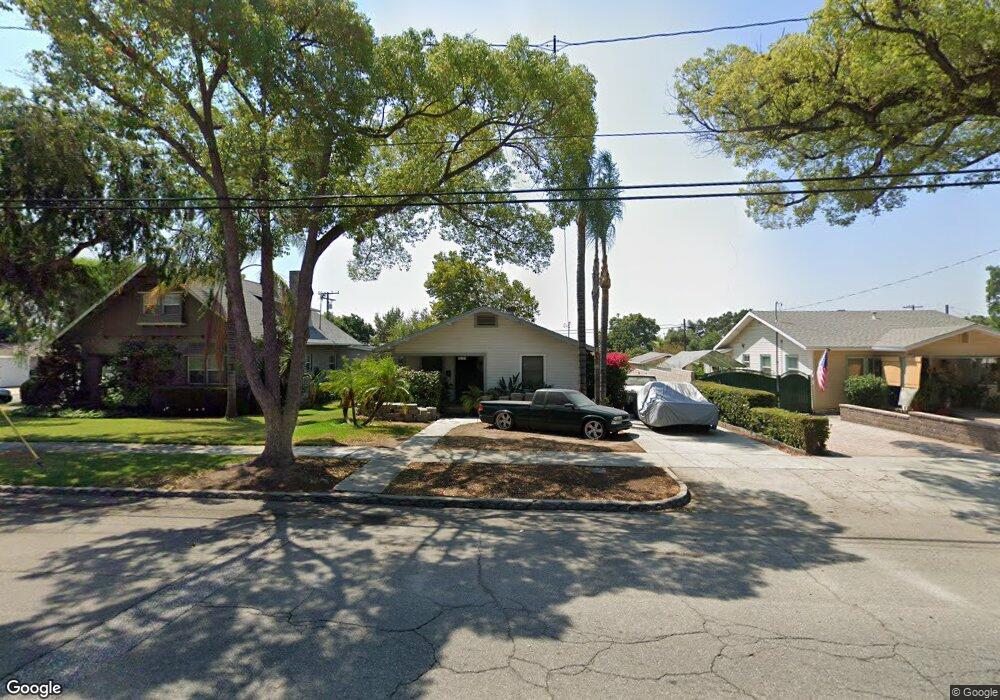
872 E 9th St Upland, CA 91786
Estimated Value: $629,408 - $699,000
3
Beds
1
Bath
1,126
Sq Ft
$593/Sq Ft
Est. Value
About This Home
This home is located at 872 E 9th St, Upland, CA 91786 and is currently estimated at $667,602, approximately $592 per square foot. 872 E 9th St is a home located in San Bernardino County with nearby schools including Upland Elementary School, Upland Junior High School, and Upland High School.
Ownership History
Date
Name
Owned For
Owner Type
Purchase Details
Closed on
May 22, 1996
Sold by
Day Betty La Raine and Palmer Harold Edward
Bought by
Rocha Frank Avina
Current Estimated Value
Home Financials for this Owner
Home Financials are based on the most recent Mortgage that was taken out on this home.
Original Mortgage
$75,000
Interest Rate
8.3%
Mortgage Type
Seller Take Back
Create a Home Valuation Report for This Property
The Home Valuation Report is an in-depth analysis detailing your home's value as well as a comparison with similar homes in the area
Home Values in the Area
Average Home Value in this Area
Purchase History
| Date | Buyer | Sale Price | Title Company |
|---|---|---|---|
| Rocha Frank Avina | $75,000 | Fidelity National Title |
Source: Public Records
Mortgage History
| Date | Status | Borrower | Loan Amount |
|---|---|---|---|
| Previous Owner | Rocha Frank Avina | $75,000 |
Source: Public Records
Tax History
| Year | Tax Paid | Tax Assessment Tax Assessment Total Assessment is a certain percentage of the fair market value that is determined by local assessors to be the total taxable value of land and additions on the property. | Land | Improvement |
|---|---|---|---|---|
| 2025 | $7,798 | $122,149 | $42,343 | $79,806 |
| 2024 | $1,469 | $119,754 | $41,513 | $78,241 |
| 2023 | $1,445 | $117,406 | $40,699 | $76,707 |
| 2022 | $1,413 | $115,104 | $39,901 | $75,203 |
| 2021 | $1,408 | $112,847 | $39,119 | $73,728 |
| 2020 | $1,370 | $111,690 | $38,718 | $72,972 |
| 2019 | $1,366 | $109,500 | $37,959 | $71,541 |
| 2018 | $1,336 | $107,353 | $37,215 | $70,138 |
| 2017 | $1,297 | $105,248 | $36,485 | $68,763 |
| 2016 | $1,328 | $103,185 | $35,770 | $67,415 |
| 2015 | $1,098 | $101,635 | $35,233 | $66,402 |
| 2014 | $1,070 | $99,644 | $34,543 | $65,101 |
Source: Public Records
Map
Nearby Homes
- 278 N 11th Ave
- 404 N 9th Ave
- 478 N Campus Ave
- 505 N 8th Ave
- 519 N 8th Ave
- 556 D St
- 1376 Chervil Way
- 511 D St
- 595 Orlando Ct
- 250 Settlers Rd
- 123 Macintosh Way
- 580 Katy Dr
- 147 Royal Way
- 308 S Campus Ave
- 559 G St
- 1320 San Bernardino Rd Unit 28
- 1350 San Bernardino Rd Unit 173
- 1350 San Bernardino Rd Unit 144
- 1350 San Bernardino Rd Unit 132
- 1350 San Bernardino Rd Unit 187
Your Personal Tour Guide
Ask me questions while you tour the home.