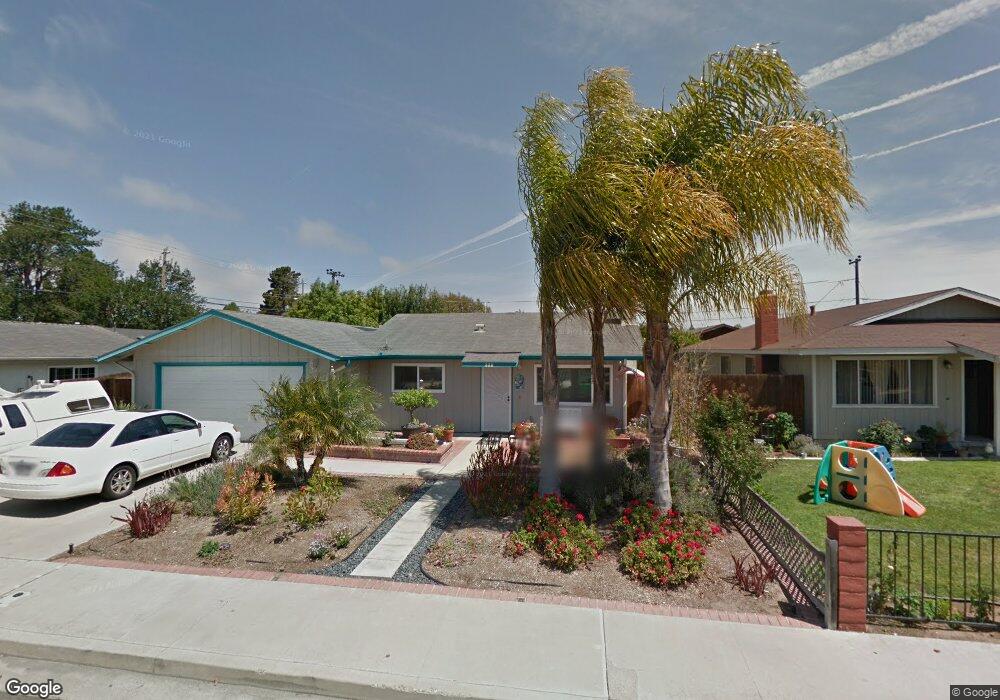
888 Olive St Arroyo Grande, CA 93420
Estimated Value: $787,027 - $856,000
3
Beds
2
Baths
1,512
Sq Ft
$549/Sq Ft
Est. Value
About This Home
This home is located at 888 Olive St, Arroyo Grande, CA 93420 and is currently estimated at $830,507, approximately $549 per square foot. 888 Olive St is a home located in San Luis Obispo County with nearby schools including Harloe Elementary School, Paulding Middle School, and Arroyo Grande High School.
Ownership History
Date
Name
Owned For
Owner Type
Purchase Details
Closed on
Jun 4, 2024
Sold by
Berguia Raymond Michael and Berguia Jeanne Marie
Bought by
Raymond Michael Berguia and Raymond Jeanne Marie
Current Estimated Value
Purchase Details
Closed on
Nov 20, 2001
Sold by
Dorr Jeanne Marie and Berguia Jeanne Marie
Bought by
Berguia Raymond Michael and Berguia Jeanne Marie
Purchase Details
Closed on
Mar 20, 1996
Sold by
Christensen Jerry and Christensen Candice
Bought by
Krueger Beatrice L
Create a Home Valuation Report for This Property
The Home Valuation Report is an in-depth analysis detailing your home's value as well as a comparison with similar homes in the area
Home Values in the Area
Average Home Value in this Area
Purchase History
We collect this data history from publicly available records. To have your information removed, we recommend requesting removal directly through your county’s website.
| Date | Buyer | Sale Price | Title Company |
|---|---|---|---|
| Raymond Michael Berguia | -- | None Listed On Document | |
| Berguia Raymond Michael | -- | -- | |
| Krueger Beatrice L | $170,000 | Fidelity National Title Ins |
Source: Public Records
Tax History
| Year | Tax Paid | Tax Assessment Tax Assessment Total Assessment is a certain percentage of the fair market value that is determined by local assessors to be the total taxable value of land and additions on the property. | Land | Improvement |
|---|---|---|---|---|
| 2025 | $2,845 | $282,165 | $125,404 | $156,761 |
| 2024 | $2,811 | $276,634 | $122,946 | $153,688 |
| 2023 | $2,811 | $271,211 | $120,536 | $150,675 |
| 2022 | $2,767 | $265,894 | $118,173 | $147,721 |
| 2021 | $2,760 | $260,681 | $115,856 | $144,825 |
| 2020 | $2,728 | $258,009 | $114,669 | $143,340 |
| 2019 | $2,707 | $252,951 | $112,421 | $140,530 |
| 2018 | $2,673 | $247,992 | $110,217 | $137,775 |
| 2017 | $2,627 | $243,130 | $108,056 | $135,074 |
| 2016 | $2,480 | $238,364 | $105,938 | $132,426 |
| 2015 | $2,458 | $234,784 | $104,347 | $130,437 |
| 2014 | $2,368 | $230,185 | $102,303 | $127,882 |
Source: Public Records
Map
Nearby Homes
- 612 Gaynfair Terrace
- 326 Cerro Vista Ln Unit Lot 5
- 341 Cerro Vista Ln Unit Lot 19
- 359 Cerro Vista Ln Unit Lot 22
- 320 Cerro Vista Ln Unit Lot 4
- 359 Cerro Vista Ln
- 245 Walnut St
- 1158 Pacific Pointe Way
- 270 Walnut St
- 1165 Maple St Unit E
- 1176 Maple St
- 1215 Farroll Ave Unit B
- 232 S Elm St
- 100 Oak St
- 414 E Grand Ave
- 1339 24th St
- 2510 Terrace Sands Ln
- 1323 Glenbrook Way
- 1433 Ronald Way
- 1452 Ronald Way
- 880 Farroll Ave
- 870 Farroll Ave
- 501 S Halcyon Rd
- 495 S Halcyon Rd
- 862 Farroll Ave
- 551 S Halcyon Rd
- 885 Olive St
- 895 Olive St
- 850 Forest Glen Dr
- 856 Farroll Ave
- 856 Forest Glen Dr
- 875 Olive St
- 842 Forest Glen Dr
- 903 Farroll Ave
- 559 S Halcyon Rd
- 834 Forest Glen Dr
- 865 Olive St
- 894 Olive St
- 882 Olive St
- 904 Sandalwood Ave
Your Personal Tour Guide
Ask me questions while you tour the home.