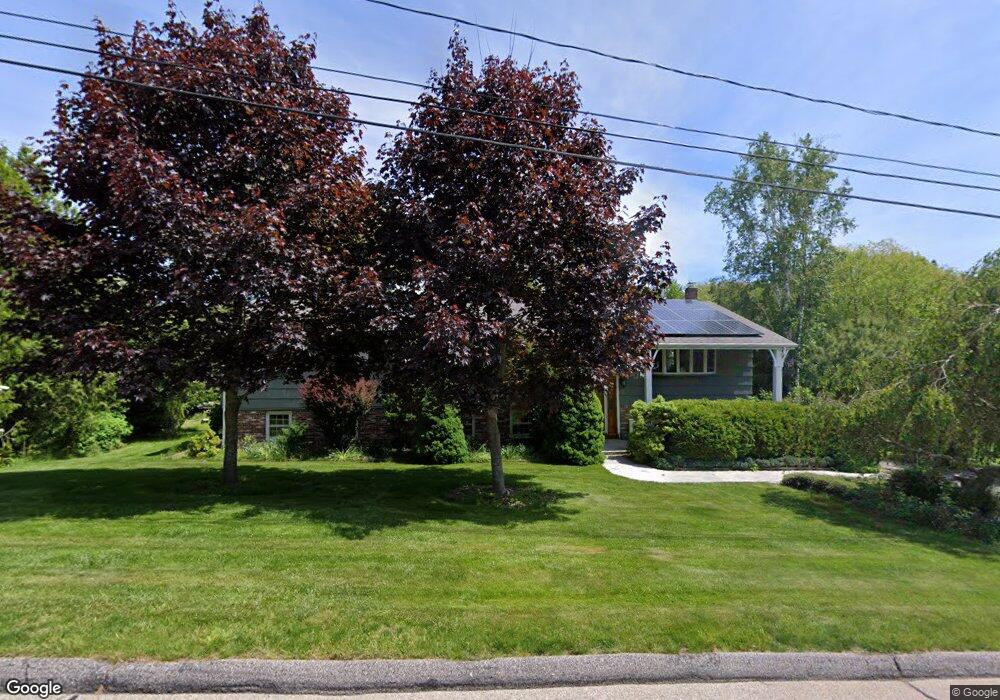
9 Meadow Ave Stonington, CT 06378
Estimated Value: $512,048 - $643,000
4
Beds
3
Baths
1,772
Sq Ft
$337/Sq Ft
Est. Value
About This Home
This home is located at 9 Meadow Ave, Stonington, CT 06378 and is currently estimated at $597,016, approximately $336 per square foot. 9 Meadow Ave is a home located in New London County with nearby schools including Stonington Middle School, Stonington High School, and Pine Point School.
Ownership History
Date
Name
Owned For
Owner Type
Purchase Details
Closed on
Dec 28, 2012
Sold by
Breslin Carol and Holdridge David
Bought by
Sundman Robert
Current Estimated Value
Purchase Details
Closed on
Oct 22, 2009
Sold by
Olmstead Timothy J and Olmstead Stephanie A
Bought by
Sundman Robert E
Create a Home Valuation Report for This Property
The Home Valuation Report is an in-depth analysis detailing your home's value as well as a comparison with similar homes in the area
Home Values in the Area
Average Home Value in this Area
Purchase History
| Date | Buyer | Sale Price | Title Company |
|---|---|---|---|
| Sundman Robert | -- | -- | |
| Sundman Robert | -- | -- | |
| Sundman Robert E | $5,000,000 | -- | |
| Sundman Robert E | $5,000,000 | -- |
Source: Public Records
Mortgage History
| Date | Status | Borrower | Loan Amount |
|---|---|---|---|
| Previous Owner | Sundman Robert E | $200,000 | |
| Previous Owner | Sundman Robert E | $53,000 | |
| Previous Owner | Sundman Robert E | $62,164 |
Source: Public Records
Tax History Compared to Growth
Tax History
| Year | Tax Paid | Tax Assessment Tax Assessment Total Assessment is a certain percentage of the fair market value that is determined by local assessors to be the total taxable value of land and additions on the property. | Land | Improvement |
|---|---|---|---|---|
| 2025 | $2,456 | $131,500 | $47,300 | $84,200 |
| 2024 | $2,364 | $131,500 | $47,300 | $84,200 |
| 2023 | $2,360 | $131,500 | $47,300 | $84,200 |
| 2022 | $2,542 | $105,000 | $49,300 | $55,700 |
| 2021 | $2,477 | $101,300 | $49,300 | $52,000 |
| 2020 | $2,432 | $101,300 | $49,300 | $52,000 |
| 2019 | $2,432 | $101,300 | $49,300 | $52,000 |
| 2018 | $2,363 | $101,300 | $49,300 | $52,000 |
| 2017 | $2,238 | $94,500 | $49,300 | $45,200 |
| 2016 | $2,174 | $94,500 | $49,300 | $45,200 |
| 2015 | $2,081 | $94,500 | $49,300 | $45,200 |
| 2014 | $1,997 | $94,500 | $49,300 | $45,200 |
Source: Public Records
Map
Nearby Homes