908 B St Fillmore, CA 93015
Estimated Value: $2,401,084
Studio
--
Bath
12,195
Sq Ft
$197/Sq Ft
Est. Value
About This Home
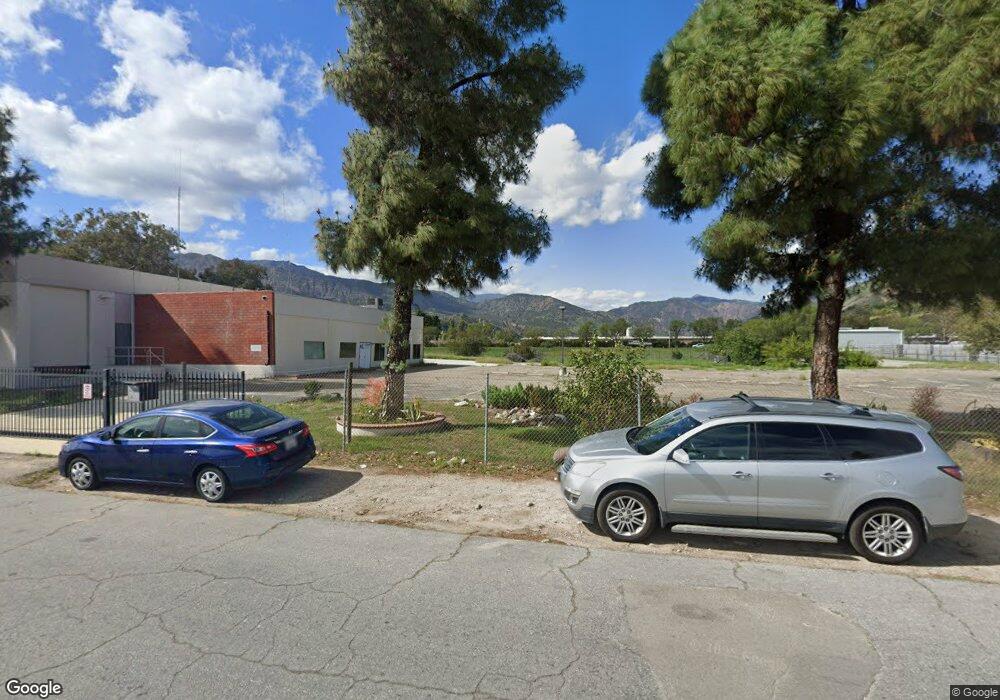
This home is located at 908 B St, Fillmore, CA 93015 and is currently estimated at $2,401,084, approximately $196 per square foot. 908 B St is a home located in Ventura County with nearby schools including Fillmore Senior High.
Ownership History
Date
Name
Owned For
Owner Type
Purchase Details
Closed on
Jun 13, 2022
Sold by
Chinook Fillmore Investors Llc
Bought by
Golshanies Properties Llc
Current Estimated Value
Purchase Details
Closed on
Aug 13, 2014
Sold by
Glade Robert S and Glade Annette J
Bought by
Chinook Filmore Investors Llc
Purchase Details
Closed on
Apr 30, 2014
Sold by
Black Laurie and Black Jeffrey
Bought by
Black Laurie and Black Jeffrey
Purchase Details
Closed on
Feb 5, 2013
Sold by
Black Natalye
Bought by
Black Natalye S
Purchase Details
Closed on
Oct 28, 2010
Sold by
Pla Herbert R Kornfeld Md Profit Sharing
Bought by
Fidelity Mortgage Lenders Inc
Purchase Details
Closed on
Mar 25, 2010
Sold by
Keller Development Associates Llc
Bought by
Glade Robert S and Glade Annette J
Purchase Details
Closed on
Mar 29, 2007
Sold by
Olson Urban Housing Llc
Bought by
Keller Development Associates Llc
Home Financials for this Owner
Home Financials are based on the most recent Mortgage that was taken out on this home.
Original Mortgage
$1,750,000
Interest Rate
6.2%
Mortgage Type
Commercial
Purchase Details
Closed on
Jul 23, 1999
Sold by
Fillmore Dp
Bought by
Keller Development Associates Llc
Create a Home Valuation Report for This Property
The Home Valuation Report is an in-depth analysis detailing your home's value as well as a comparison with similar homes in the area
Home Values in the Area
Average Home Value in this Area
Purchase History
| Date | Buyer | Sale Price | Title Company |
|---|---|---|---|
| Golshanies Properties Llc | $2,275,000 | Lawyers Title | |
| Chinook Filmore Investors Llc | -- | Accommodation | |
| Black Laurie | -- | None Available | |
| Black Natalye S | -- | Old Republic Title Ins Co | |
| Fidelity Mortgage Lenders Inc | $92,500 | Accommodation | |
| Glade Robert S | $500,000 | Accommodation | |
| Keller Development Associates Llc | -- | Accommodation | |
| Keller Development Associates Llc | $710,000 | Lawyers Title Company |
Source: Public Records
Mortgage History
| Date | Status | Borrower | Loan Amount |
|---|---|---|---|
| Previous Owner | Keller Development Associates Llc | $1,750,000 | |
| Closed | Keller Development Associates Llc | $0 |
Source: Public Records
Tax History
| Year | Tax Paid | Tax Assessment Tax Assessment Total Assessment is a certain percentage of the fair market value that is determined by local assessors to be the total taxable value of land and additions on the property. | Land | Improvement |
|---|---|---|---|---|
| 2025 | $41,138 | $2,414,248 | $1,774,340 | $639,908 |
| 2024 | $41,138 | $2,366,910 | $1,739,549 | $627,361 |
| 2023 | $40,713 | $2,320,500 | $1,705,440 | $615,060 |
| 2022 | $30,659 | $1,502,367 | $1,423,731 | $78,636 |
| 2021 | $32,673 | $1,472,909 | $1,395,814 | $77,095 |
| 2020 | $31,825 | $1,457,807 | $1,381,502 | $76,305 |
| 2019 | $31,410 | $1,429,223 | $1,354,414 | $74,809 |
| 2018 | $30,908 | $1,401,200 | $1,327,857 | $73,343 |
| 2017 | $30,779 | $1,373,726 | $1,301,821 | $71,905 |
| 2016 | $29,302 | $1,346,792 | $1,276,296 | $70,496 |
| 2015 | $29,003 | $1,326,564 | $1,257,126 | $69,438 |
| 2014 | $28,794 | $1,300,580 | $1,232,501 | $68,079 |
Source: Public Records
Map
Nearby Homes
- 831 Blaine Ave
- 949 Blaine Ave
- 815 Woodgrove Rd
- 809 Woodgrove Rd
- 600 C St
- 1106 Mockingbird Ln
- 345 Blaine Ave
- 1560 Goodenough Rd
- 313 C St
- 639 Mountain View St
- 1262 Sespe Ave
- 404 Central Ave
- 320 D St
- 318 Bard St
- 340 Central Ave
- 1172 Oak Ave
- 1163 W Ventura St
- 616 Island View St
- 228 Parkhaven Ct
- 578 Apricot Ln
Your Personal Tour Guide
Ask me questions while you tour the home.