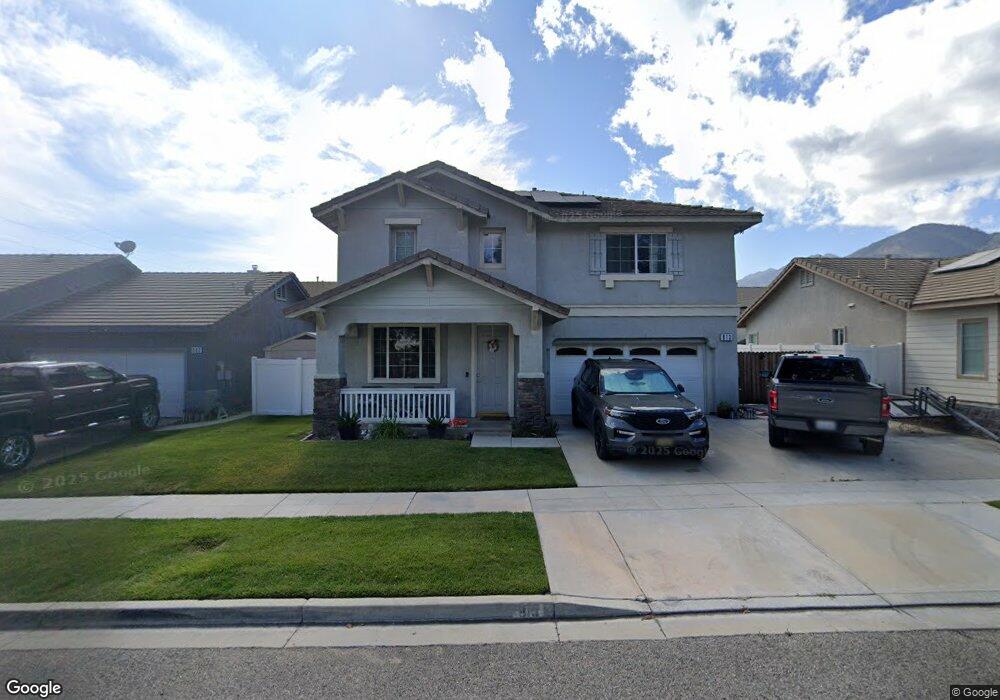
913 B St Fillmore, CA 93015
Estimated Value: $754,000 - $840,000
4
Beds
2
Baths
2,114
Sq Ft
$371/Sq Ft
Est. Value
About This Home
This home is located at 913 B St, Fillmore, CA 93015 and is currently estimated at $784,839, approximately $371 per square foot. 913 B St is a home located in Ventura County with nearby schools including Fillmore Senior High.
Ownership History
Date
Name
Owned For
Owner Type
Purchase Details
Closed on
Jun 21, 2021
Sold by
Boller Ryan Landon
Bought by
Boller Ryan Landon and Boller Carol
Current Estimated Value
Home Financials for this Owner
Home Financials are based on the most recent Mortgage that was taken out on this home.
Original Mortgage
$447,000
Outstanding Balance
$404,703
Interest Rate
2.9%
Mortgage Type
New Conventional
Estimated Equity
$380,136
Purchase Details
Closed on
Apr 23, 2012
Sold by
Boller Carol Marie
Bought by
Boller Ryan Landon
Home Financials for this Owner
Home Financials are based on the most recent Mortgage that was taken out on this home.
Original Mortgage
$310,913
Interest Rate
4.5%
Mortgage Type
FHA
Purchase Details
Closed on
Apr 2, 2012
Sold by
Wheat Michael Douglas
Bought by
Boller Ryan Landon
Home Financials for this Owner
Home Financials are based on the most recent Mortgage that was taken out on this home.
Original Mortgage
$310,913
Interest Rate
4.5%
Mortgage Type
FHA
Purchase Details
Closed on
Jul 12, 2010
Sold by
Wheat Jacklyn S
Bought by
Wheat Michael Douglas
Home Financials for this Owner
Home Financials are based on the most recent Mortgage that was taken out on this home.
Original Mortgage
$300,947
Interest Rate
4.87%
Mortgage Type
FHA
Purchase Details
Closed on
Jun 10, 2010
Sold by
The Bank Of New York Mellon
Bought by
Wheat Michael Douglas
Home Financials for this Owner
Home Financials are based on the most recent Mortgage that was taken out on this home.
Original Mortgage
$300,947
Interest Rate
4.87%
Mortgage Type
FHA
Purchase Details
Closed on
Feb 18, 2010
Sold by
Conley Paul D and Conley Pamela L
Bought by
The Bank Of New York Mellon and The Bank Of New York
Purchase Details
Closed on
Jul 11, 2003
Sold by
Suan Ronald and Suan Teresa
Bought by
Conley Paul D and Conley Pamela L
Home Financials for this Owner
Home Financials are based on the most recent Mortgage that was taken out on this home.
Original Mortgage
$311,200
Interest Rate
6.35%
Mortgage Type
Purchase Money Mortgage
Purchase Details
Closed on
Aug 9, 2002
Sold by
Suan Ronald
Bought by
Suan Ronald and Suan Teresa
Purchase Details
Closed on
Jun 25, 2002
Sold by
Suan Teresa
Bought by
Suan Ronald
Purchase Details
Closed on
Apr 17, 2002
Sold by
Griffin Homebuilding Group Llc
Bought by
Suan Ronald
Home Financials for this Owner
Home Financials are based on the most recent Mortgage that was taken out on this home.
Original Mortgage
$247,350
Interest Rate
6.86%
Create a Home Valuation Report for This Property
The Home Valuation Report is an in-depth analysis detailing your home's value as well as a comparison with similar homes in the area
Home Values in the Area
Average Home Value in this Area
Purchase History
| Date | Buyer | Sale Price | Title Company |
|---|---|---|---|
| Boller Ryan Landon | -- | Chicago Title Company | |
| Boller Ryan Landon | -- | Advantage Title Company | |
| Boller Ryan Landon | $319,000 | Advantage Title Company | |
| Wheat Michael Douglas | -- | Servicelink | |
| Wheat Michael Douglas | $305,000 | Servicelink | |
| The Bank Of New York Mellon | $340,000 | Accommodation | |
| Conley Paul D | $389,000 | Chicago Title Co | |
| Suan Ronald | -- | -- | |
| Suan Ronald | -- | First American Title Ins Co | |
| Suan Ronald | $309,500 | First American Title Ins Co |
Source: Public Records
Mortgage History
| Date | Status | Borrower | Loan Amount |
|---|---|---|---|
| Open | Boller Ryan Landon | $447,000 | |
| Closed | Boller Ryan Landon | $310,913 | |
| Previous Owner | Wheat Michael Douglas | $300,947 | |
| Previous Owner | Conley Paul D | $311,200 | |
| Previous Owner | Suan Ronald | $247,350 | |
| Closed | Conley Paul D | $77,800 |
Source: Public Records
Tax History
| Year | Tax Paid | Tax Assessment Tax Assessment Total Assessment is a certain percentage of the fair market value that is determined by local assessors to be the total taxable value of land and additions on the property. | Land | Improvement |
|---|---|---|---|---|
| 2025 | $6,228 | $458,847 | $200,334 | $258,513 |
| 2024 | $6,228 | $449,850 | $196,405 | $253,445 |
| 2023 | $6,154 | $441,030 | $192,554 | $248,476 |
| 2022 | $5,741 | $432,383 | $188,779 | $243,604 |
| 2021 | $6,326 | $423,905 | $185,077 | $238,828 |
| 2020 | $5,942 | $419,560 | $183,180 | $236,380 |
| 2019 | $5,307 | $359,178 | $179,589 | $179,589 |
| 2018 | $5,197 | $352,136 | $176,068 | $176,068 |
| 2017 | $5,194 | $345,232 | $172,616 | $172,616 |
| 2016 | $4,855 | $338,464 | $169,232 | $169,232 |
| 2015 | $4,737 | $333,382 | $166,691 | $166,691 |
| 2014 | $4,711 | $326,854 | $163,427 | $163,427 |
Source: Public Records
Map
Nearby Homes
- 831 Blaine Ave
- 949 Blaine Ave
- 815 Woodgrove Rd
- 809 Woodgrove Rd
- 600 C St
- 1106 Mockingbird Ln
- 345 Blaine Ave
- 313 C St
- 1560 Goodenough Rd
- 1262 Sespe Ave
- 404 Central Ave
- 639 Mountain View St
- 320 D St
- 340 Central Ave
- 318 Bard St
- 1172 Oak Ave
- 1163 W Ventura St
- 616 Island View St
- 228 Parkhaven Ct
- 578 Apricot Ln
Your Personal Tour Guide
Ask me questions while you tour the home.