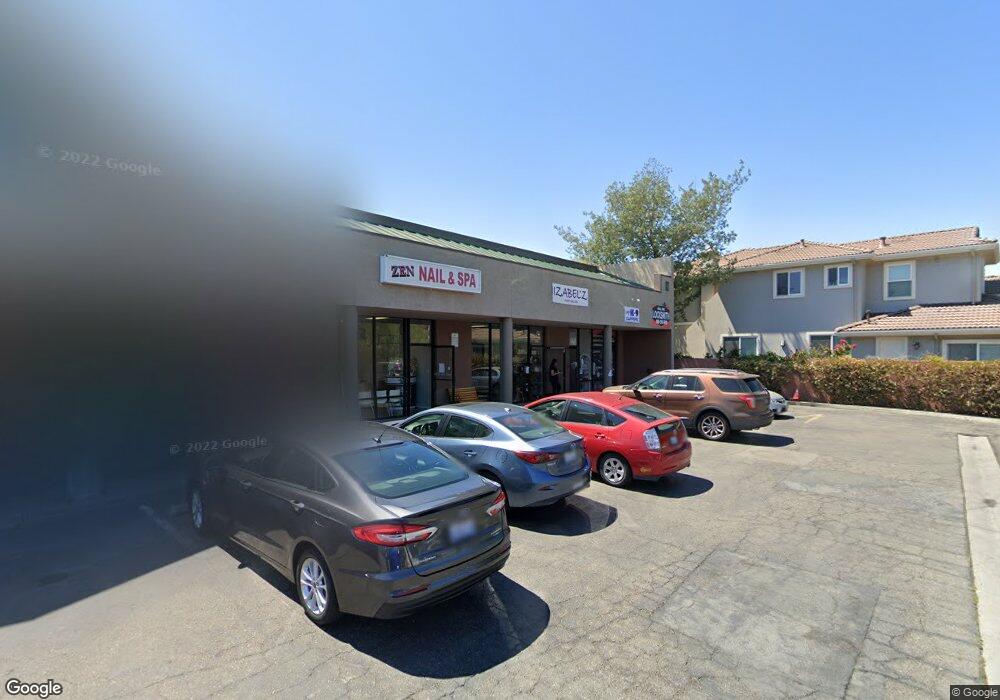
915 S San Tomas Aquino Rd Campbell, CA 95008
San Tomas NeighborhoodEstimated Value: $3,445,508
--
Bed
--
Bath
1,860
Sq Ft
$1,852/Sq Ft
Est. Value
About This Home
This home is located at 915 S San Tomas Aquino Rd, Campbell, CA 95008 and is currently estimated at $3,445,508, approximately $1,852 per square foot. 915 S San Tomas Aquino Rd is a home located in Santa Clara County with nearby schools including Westmont High School, Forest Hill Elementary School, and Village School.
Ownership History
Date
Name
Owned For
Owner Type
Purchase Details
Closed on
Mar 13, 2008
Sold by
Ferrari Raabe Iii Ralph C and Ferrari Raabe Teresa
Bought by
Ferrari Raabe Iii Ralph Christian and Ferrari Raabe Teresa
Current Estimated Value
Purchase Details
Closed on
Feb 14, 2002
Sold by
Ferrari Stephen A
Bought by
Ferrari Stephen A and Ferrari Joan Petrilli
Purchase Details
Closed on
Nov 29, 1994
Sold by
Ferrari Ferrari Stephen A Stephen A and Ferrari Raabe Teresa
Bought by
Ferrari Ferrari Stephen A Stephen A and Ferrari Raabe Teresa
Purchase Details
Closed on
Mar 15, 1994
Sold by
Raabe Ralph C
Bought by
Raabe Teresa Ferrari
Home Financials for this Owner
Home Financials are based on the most recent Mortgage that was taken out on this home.
Original Mortgage
$200,000
Interest Rate
7%
Mortgage Type
Commercial
Create a Home Valuation Report for This Property
The Home Valuation Report is an in-depth analysis detailing your home's value as well as a comparison with similar homes in the area
Home Values in the Area
Average Home Value in this Area
Purchase History
| Date | Buyer | Sale Price | Title Company |
|---|---|---|---|
| Ferrari Raabe Iii Ralph Christian | -- | None Available | |
| Ferrari Stephen A | -- | -- | |
| Ferrari Ferrari Stephen A Stephen A | -- | Golden California Title Co | |
| Raabe Teresa Ferrari | -- | Golden California Title Co | |
| Ferrari Stephen A | -- | -- | |
| Ferrari Ferrari Stephen A Stephen A | $827,000 | Golden California Title Co |
Source: Public Records
Mortgage History
| Date | Status | Borrower | Loan Amount |
|---|---|---|---|
| Closed | Raabe Teresa Ferrari | $200,000 |
Source: Public Records
Tax History Compared to Growth
Tax History
| Year | Tax Paid | Tax Assessment Tax Assessment Total Assessment is a certain percentage of the fair market value that is determined by local assessors to be the total taxable value of land and additions on the property. | Land | Improvement |
|---|---|---|---|---|
| 2025 | $20,607 | $1,389,103 | $604,686 | $784,417 |
| 2024 | $20,607 | $1,361,867 | $592,830 | $769,037 |
| 2023 | $20,511 | $1,335,164 | $581,206 | $753,958 |
| 2022 | $19,848 | $1,308,985 | $569,810 | $739,175 |
| 2021 | $22,063 | $1,283,320 | $558,638 | $724,682 |
| 2020 | $24,193 | $1,270,162 | $552,910 | $717,252 |
| 2019 | $21,497 | $1,245,258 | $542,069 | $703,189 |
| 2018 | $19,811 | $1,220,842 | $531,441 | $689,401 |
| 2017 | $19,078 | $1,196,905 | $521,021 | $675,884 |
| 2016 | $18,429 | $1,173,437 | $510,805 | $662,632 |
| 2015 | $17,260 | $1,155,812 | $503,133 | $652,679 |
| 2014 | -- | $1,133,172 | $493,278 | $639,894 |
Source: Public Records
Map
Nearby Homes
- 935 S San Tomas Aquino Rd
- 4065 Keith Dr
- 1170 Steinway Ave
- 2267 Fenian Dr
- 816 Waldo Rd
- 1089 Audrey Ave
- 2476 Le Bain Dr
- 1297 Virginia Ave
- 614 Beta Ct
- 668 W Sunnyoaks Ave
- 2183 Abbey Ln
- 1162 Capri Dr
- 4736 Westmont Ave
- 1152 Capri Dr
- 107 Naramore Ln
- 146 English Rose Cir
- 265 Wren Way
- 4599 Tilbury Dr
- 615 Chapman Dr
- 875 Emory Ave
- 915 S San Tomas Aquino Rd
- 1284 Elam Ave
- 895 S San Tomas Aquino Rd
- 1275 Elam Ave
- 1281 Elam Ave
- 1294 Elam Ave
- 900 S San Tomas Aquino Rd
- 957 Jonathan Ct
- 955 Jonathan Ct
- 959 Jonathan Ct
- 900 S San Tomas Aquino Rd
- 1287 Elam Ave
- 885 S San Tomas Aquino Rd
- 920 S San Tomas Aquino Rd
- 1300 Elam Ave
- 1291 Elam Ave
- 944 S San Tomas Aquino Rd
- 930 S San Tomas Aquino Rd
- 961 Jonathan Ct
- 1250 Cobblestone Dr