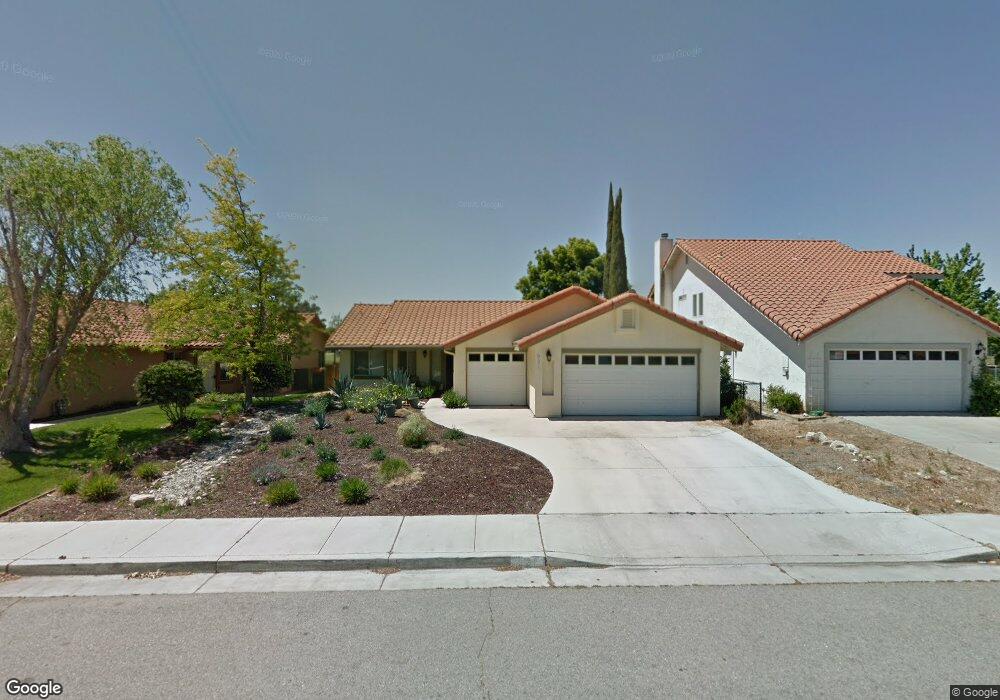
921 Torrey Pines Dr Paso Robles, CA 93446
Estimated Value: $710,000 - $758,000
3
Beds
2
Baths
1,600
Sq Ft
$455/Sq Ft
Est. Value
About This Home
This home is located at 921 Torrey Pines Dr, Paso Robles, CA 93446 and is currently estimated at $727,931, approximately $454 per square foot. 921 Torrey Pines Dr is a home located in San Luis Obispo County with nearby schools including Pat Butler Elementary School, George H. Flamson Middle School, and Paso Robles High School.
Ownership History
Date
Name
Owned For
Owner Type
Purchase Details
Closed on
Apr 3, 2013
Sold by
Roe Monika K
Bought by
Roe Monika K
Current Estimated Value
Home Financials for this Owner
Home Financials are based on the most recent Mortgage that was taken out on this home.
Original Mortgage
$311,893
Outstanding Balance
$220,851
Interest Rate
3.54%
Mortgage Type
New Conventional
Estimated Equity
$507,080
Purchase Details
Closed on
May 22, 2009
Sold by
Roe Monika K
Bought by
Roe Monika K
Purchase Details
Closed on
Aug 15, 2008
Sold by
Roe Michael B and Roe Monika K
Bought by
Roe Monika K
Purchase Details
Closed on
Jun 14, 2007
Sold by
Bane Sandra J
Bought by
Roe Michael B and Roe Monika K
Home Financials for this Owner
Home Financials are based on the most recent Mortgage that was taken out on this home.
Original Mortgage
$43,000
Interest Rate
6.36%
Mortgage Type
Stand Alone Second
Purchase Details
Closed on
Jan 31, 2005
Sold by
Bane Sandra
Bought by
Bane Sandra J
Purchase Details
Closed on
Nov 30, 2000
Sold by
Powell Mary Jean
Bought by
Powell Mary Jean
Create a Home Valuation Report for This Property
The Home Valuation Report is an in-depth analysis detailing your home's value as well as a comparison with similar homes in the area
Home Values in the Area
Average Home Value in this Area
Purchase History
| Date | Buyer | Sale Price | Title Company |
|---|---|---|---|
| Roe Monika K | -- | Fidelity National Title Co | |
| Roe Monika K | -- | Fidelity National Title Co | |
| Roe Monika K | -- | None Available | |
| Roe Monika K | -- | None Available | |
| Roe Michael B | $415,000 | Fidelity National Title Co | |
| Bane Sandra J | -- | -- | |
| Powell Mary Jean | -- | -- |
Source: Public Records
Mortgage History
| Date | Status | Borrower | Loan Amount |
|---|---|---|---|
| Open | Roe Monika K | $311,893 | |
| Closed | Roe Michael B | $43,000 | |
| Closed | Roe Michael B | $332,000 |
Source: Public Records
Tax History Compared to Growth
Tax History
| Year | Tax Paid | Tax Assessment Tax Assessment Total Assessment is a certain percentage of the fair market value that is determined by local assessors to be the total taxable value of land and additions on the property. | Land | Improvement |
|---|---|---|---|---|
| 2025 | $5,941 | $545,094 | $275,832 | $269,262 |
| 2024 | $5,844 | $534,407 | $270,424 | $263,983 |
| 2023 | $5,844 | $523,929 | $265,122 | $258,807 |
| 2022 | $5,757 | $513,657 | $259,924 | $253,733 |
| 2021 | $5,659 | $503,586 | $254,828 | $248,758 |
| 2020 | $5,264 | $470,000 | $255,000 | $215,000 |
| 2019 | $5,180 | $460,000 | $250,000 | $210,000 |
| 2018 | $5,212 | $460,000 | $250,000 | $210,000 |
| 2017 | $4,836 | $445,000 | $230,000 | $215,000 |
| 2016 | $4,401 | $405,000 | $205,000 | $200,000 |
| 2015 | $4,265 | $388,000 | $195,000 | $193,000 |
| 2014 | $4,123 | $388,000 | $195,000 | $193,000 |
Source: Public Records
Map
Nearby Homes
- 919 Torrey Pines Dr
- 918 Inverness Dr
- 911 Saint Ann Dr
- 907 Saint Ann Dr
- 909 Palm Desert Ct
- 1716 Wade Dr
- 789 Oxen St
- 128 Flag Way Unit A
- 924 Moran Ct
- 915 Moran Ct
- 912 Wade Dr
- 17 Green Ct
- 1685 Arbolado Rd
- 1337 Stoney Creek Rd
- 1128 Golf Place
- 1050 Sleepy Hollow Rd
- 204 Nighthawk Dr
- 1024 Rachel Ln
- 207 Quarterhorse Ln
- 1951 Tulipwood Dr
- 923 Torrey Pines Dr
- 917 Torrey Pines Dr
- 925 Torrey Pines Dr
- 922 Torrey Pines Dr
- 920 Torrey Pines Dr
- 924 Torrey Pines Dr
- 918 Torrey Pines Dr
- 915 Torrey Pines Dr
- 927 Torrey Pines Dr
- 926 Torrey Pines Dr
- 916 Torrey Pines Dr
- 913 Torrey Pines Dr
- 928 Torrey Pines Dr
- 929 Torrey Pines Dr
- 914 Torrey Pines Dr
- 911 Torrey Pines Dr
- 930 Torrey Pines Dr
- 912 Torrey Pines Dr
- 931 Torrey Pines Dr
- 912 Spyglass Ct