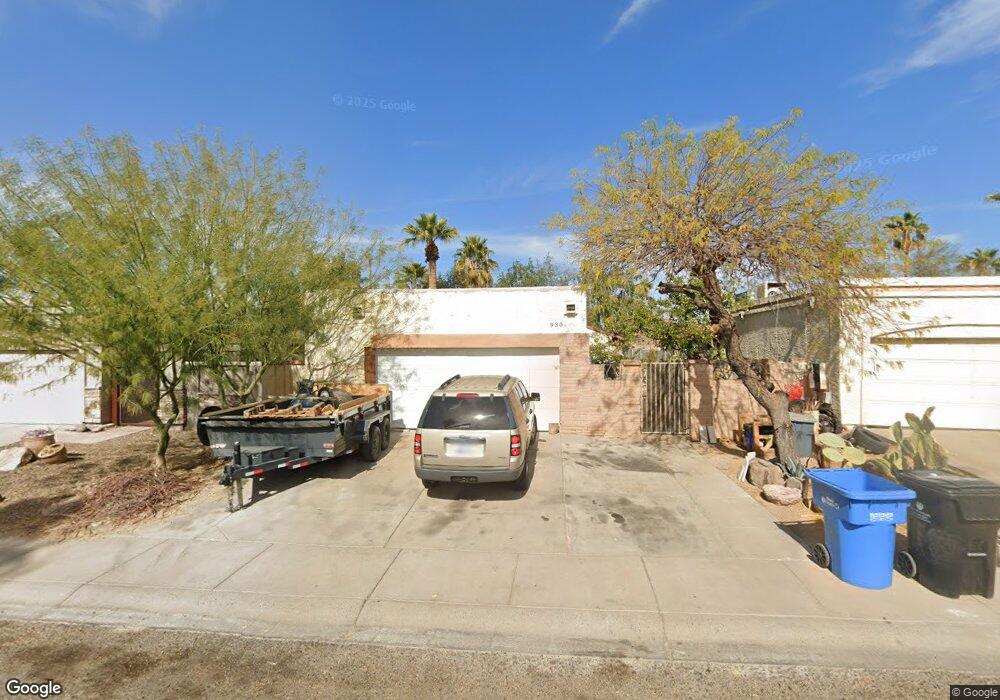
930 E Wahalla Ln Phoenix, AZ 85024
North Central Phoenix NeighborhoodEstimated Value: $309,860 - $411,000
--
Bed
2
Baths
1,232
Sq Ft
$294/Sq Ft
Est. Value
About This Home
This home is located at 930 E Wahalla Ln, Phoenix, AZ 85024 and is currently estimated at $362,465, approximately $294 per square foot. 930 E Wahalla Ln is a home located in Maricopa County with nearby schools including Eagle Ridge Elementary School, Mountain Trail Middle School, and North Canyon High School.
Ownership History
Date
Name
Owned For
Owner Type
Purchase Details
Closed on
Feb 12, 2016
Sold by
Carreon Jose Vazquez and Ramirez Guadalupe
Bought by
Carreon Jose Vazquez and Ramirez Guadalupe
Current Estimated Value
Home Financials for this Owner
Home Financials are based on the most recent Mortgage that was taken out on this home.
Original Mortgage
$90,000
Outstanding Balance
$71,793
Interest Rate
3.97%
Mortgage Type
New Conventional
Estimated Equity
$290,672
Purchase Details
Closed on
Nov 3, 1998
Sold by
Ures Frank J
Bought by
Carreon Jose Vasquez and Ramirez Guadalupe
Home Financials for this Owner
Home Financials are based on the most recent Mortgage that was taken out on this home.
Original Mortgage
$82,260
Interest Rate
6.61%
Mortgage Type
FHA
Purchase Details
Closed on
Nov 30, 1995
Sold by
Ures Frank J
Bought by
Ures Frank J and The Frank J Ures Jr Revocable Living Tr
Create a Home Valuation Report for This Property
The Home Valuation Report is an in-depth analysis detailing your home's value as well as a comparison with similar homes in the area
Home Values in the Area
Average Home Value in this Area
Purchase History
| Date | Buyer | Sale Price | Title Company |
|---|---|---|---|
| Carreon Jose Vazquez | -- | First American Title Ins Co | |
| Carreon Jose Vasquez | $82,500 | Old Republic Title Agency | |
| Ures Frank J | -- | -- |
Source: Public Records
Mortgage History
| Date | Status | Borrower | Loan Amount |
|---|---|---|---|
| Open | Carreon Jose Vazquez | $90,000 | |
| Closed | Carreon Jose Vasquez | $82,260 |
Source: Public Records
Tax History
| Year | Tax Paid | Tax Assessment Tax Assessment Total Assessment is a certain percentage of the fair market value that is determined by local assessors to be the total taxable value of land and additions on the property. | Land | Improvement |
|---|---|---|---|---|
| 2025 | $1,045 | $10,228 | -- | -- |
| 2024 | $997 | $9,741 | -- | -- |
| 2023 | $997 | $26,050 | $5,210 | $20,840 |
| 2022 | $987 | $19,400 | $3,880 | $15,520 |
| 2021 | $990 | $17,780 | $3,550 | $14,230 |
| 2020 | $959 | $16,370 | $3,270 | $13,100 |
| 2019 | $960 | $16,030 | $3,200 | $12,830 |
| 2018 | $929 | $14,580 | $2,910 | $11,670 |
| 2017 | $1,020 | $11,760 | $2,350 | $9,410 |
| 2016 | $746 | $11,160 | $2,230 | $8,930 |
| 2015 | $692 | $10,680 | $2,130 | $8,550 |
Source: Public Records
Map
Nearby Homes
- 20220 N 9th St
- 19648 N 9th St
- 1002 E Oraibi Dr
- 20238 N 9th St
- 922 E Blackhawk Dr
- 19613 N 9th St
- 1226 E Wahalla Ln
- 1017 E Montoya Ln
- 936 E Montoya Ln
- 19801 N 6th Place
- 19601 N 7th St Unit 1056
- 19601 N 7th St Unit 2026
- 19601 N 7th St Unit 2107
- 19601 N 7th St Unit 1005
- 19407 N 9th St
- 941 E Potter Dr
- 910 E Potter Dr
- 19401 N 7th St Unit 142
- 19401 N 7th St Unit 60
- 19401 N 7th St Unit 187
- 926 E Wahalla Ln
- 938 E Wahalla Ln
- 922 E Wahalla Ln
- 931 E Escuda Dr
- 927 E Escuda Dr
- 935 E Escuda Dr
- 942 E Wahalla Ln
- 918 E Wahalla Ln
- 923 E Escuda Dr
- 939 E Escuda Dr
- 929 E Wahalla Ln
- 925 E Wahalla Ln
- 933 E Wahalla Ln
- 919 E Escuda Dr
- 943 E Escuda Dr
- 914 E Wahalla Ln
- 946 E Wahalla Ln
- 921 E Wahalla Ln
- 937 E Wahalla Ln
- 917 E Wahalla Ln
Your Personal Tour Guide
Ask me questions while you tour the home.