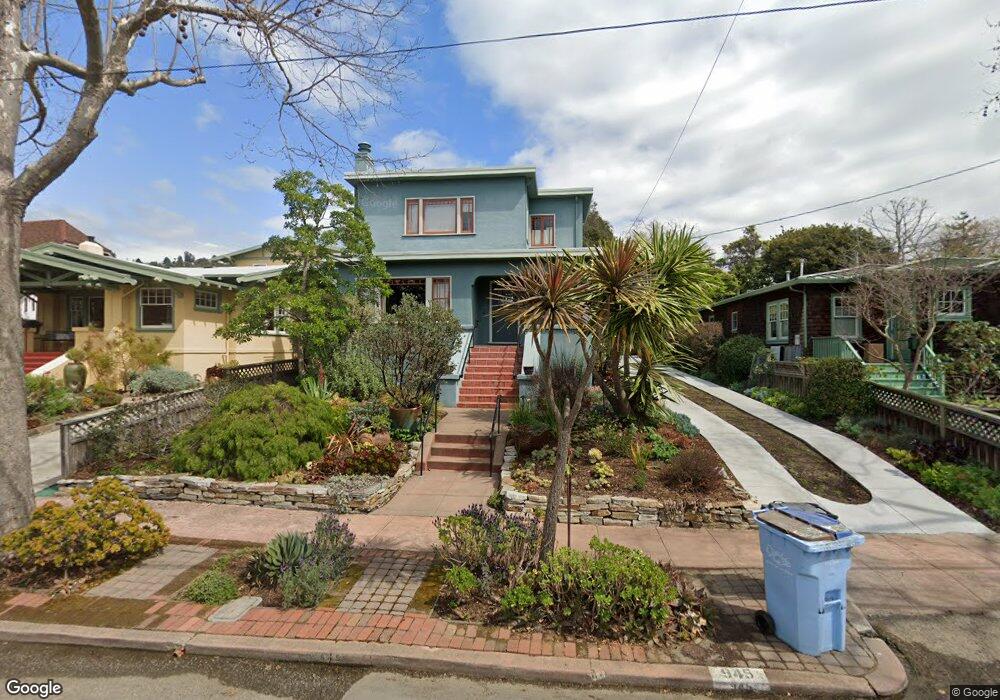
945 Fresno Ave Berkeley, CA 94707
Northbrae NeighborhoodEstimated Value: $1,987,000 - $2,564,000
4
Beds
2
Baths
2,226
Sq Ft
$1,016/Sq Ft
Est. Value
About This Home
This home is located at 945 Fresno Ave, Berkeley, CA 94707 and is currently estimated at $2,261,305, approximately $1,015 per square foot. 945 Fresno Ave is a home located in Alameda County with nearby schools including Thousand Oaks Elementary School, Ruth Acty Elementary, and Berkeley Arts Magnet at Whittier School.
Ownership History
Date
Name
Owned For
Owner Type
Purchase Details
Closed on
Mar 28, 2019
Sold by
Roden Robert S and Novick Sherry L
Bought by
Robert S Roden And Sherry Novick Liv Tr
Current Estimated Value
Purchase Details
Closed on
Aug 16, 2006
Sold by
Roden Robert S and Novick Sherry L
Bought by
Roden Robert S and Novick Sherry L
Purchase Details
Closed on
May 26, 2006
Sold by
Campbell Joe P and Campbell Cynthia A
Bought by
Roden Robert S and Novick Sherry L
Home Financials for this Owner
Home Financials are based on the most recent Mortgage that was taken out on this home.
Original Mortgage
$400,000
Interest Rate
6.52%
Mortgage Type
Fannie Mae Freddie Mac
Create a Home Valuation Report for This Property
The Home Valuation Report is an in-depth analysis detailing your home's value as well as a comparison with similar homes in the area
Home Values in the Area
Average Home Value in this Area
Purchase History
| Date | Buyer | Sale Price | Title Company |
|---|---|---|---|
| Robert S Roden And Sherry Novick Liv Tr | -- | None Available | |
| Roden Robert S | -- | Old Republic Title Company | |
| Roden Robert S | $1,300,000 | Old Republic Title Company |
Source: Public Records
Mortgage History
| Date | Status | Borrower | Loan Amount |
|---|---|---|---|
| Previous Owner | Roden Robert S | $400,000 |
Source: Public Records
Tax History
| Year | Tax Paid | Tax Assessment Tax Assessment Total Assessment is a certain percentage of the fair market value that is determined by local assessors to be the total taxable value of land and additions on the property. | Land | Improvement |
|---|---|---|---|---|
| 2025 | $25,457 | $1,769,397 | $532,919 | $1,243,478 |
| 2024 | $25,457 | $1,734,570 | $522,471 | $1,219,099 |
| 2023 | $24,946 | $1,707,432 | $512,229 | $1,195,203 |
| 2022 | $24,536 | $1,666,957 | $502,187 | $1,171,770 |
| 2021 | $24,623 | $1,634,145 | $492,343 | $1,148,802 |
| 2020 | $23,379 | $1,624,323 | $487,297 | $1,137,026 |
| 2019 | $22,549 | $1,592,486 | $477,746 | $1,114,740 |
| 2018 | $22,194 | $1,561,273 | $468,382 | $1,092,891 |
| 2017 | $21,458 | $1,530,671 | $459,201 | $1,071,470 |
| 2016 | $20,225 | $1,450,000 | $435,000 | $1,015,000 |
| 2015 | $19,704 | $1,407,000 | $422,100 | $984,900 |
| 2014 | $16,681 | $1,150,000 | $345,000 | $805,000 |
Source: Public Records
Map
Nearby Homes
- 1950 Hopkins St
- 1983 Yosemite Rd
- 826 Indian Rock Ave
- 813 San Diego Rd
- 765 San Diego Rd
- 753 Peralta Ave
- 1498 Sonoma Ave
- 1626 Hopkins St
- 2121 Eunice St
- 758 Spruce St
- 1004 Cragmont Ave
- 731 Santa fe Ave
- 1509 Francis St
- 1425 Martin Luther King jr Way
- 777 Cragmont Ave
- 1408 Henry St
- 1036 Ramona Ave
- 2315 Eunice St
- 589 San Luis Rd
- 1120 Curtis St
- 949 Fresno Ave
- 939 Fresno Ave
- 955 Fresno Ave
- 948 The Alameda
- 952 The Alameda
- 935 Fresno Ave
- 942 The Alameda
- 956 The Alameda
- 938 The Alameda
- 1825 Marin Ave
- 931 Fresno Ave
- 1827 Marin Ave
- 958 The Alameda
- 952 Fresno Ave
- 1831 Marin Ave
- 934 The Alameda
- 1811 Marin Ave
- 948 Fresno Ave
- 929 Fresno Ave
- 1837 Marin Ave
Your Personal Tour Guide
Ask me questions while you tour the home.