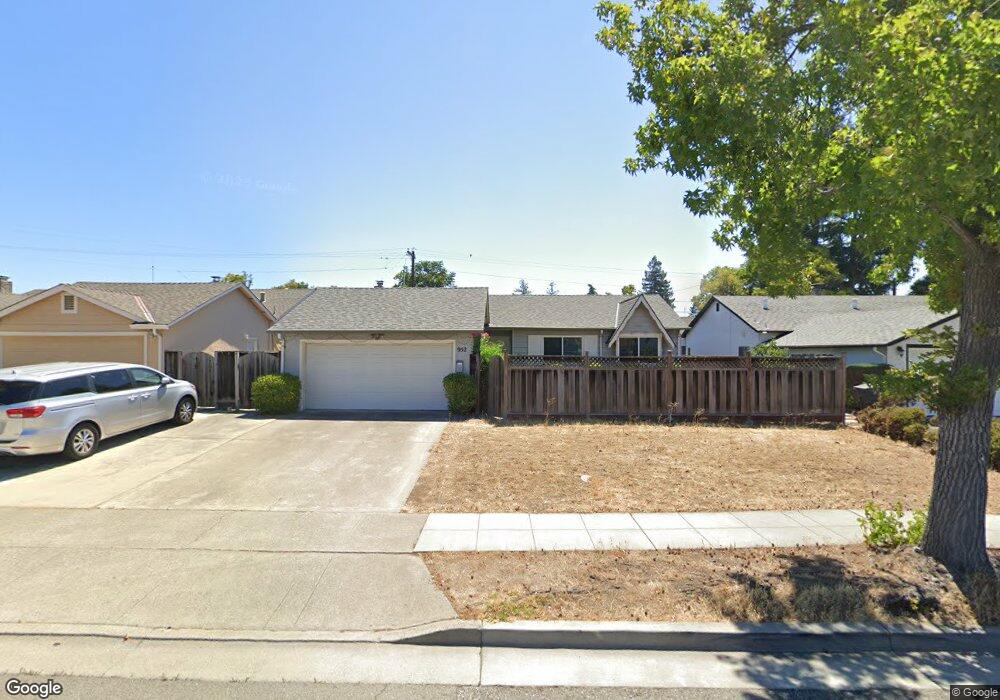
952 Sheila Ct Campbell, CA 95008
San Tomas NeighborhoodEstimated Value: $1,007,000 - $2,125,000
3
Beds
2
Baths
1,326
Sq Ft
$1,294/Sq Ft
Est. Value
About This Home
This home is located at 952 Sheila Ct, Campbell, CA 95008 and is currently estimated at $1,715,203, approximately $1,293 per square foot. 952 Sheila Ct is a home located in Santa Clara County with nearby schools including Westmont High School, Capri Elementary, and Village School.
Ownership History
Date
Name
Owned For
Owner Type
Purchase Details
Closed on
Nov 16, 2000
Sold by
Vogel Kurt C and Vogel Inna M
Bought by
Lei Jing and Qin Yunfei
Current Estimated Value
Home Financials for this Owner
Home Financials are based on the most recent Mortgage that was taken out on this home.
Original Mortgage
$449,400
Outstanding Balance
$164,058
Interest Rate
7.75%
Estimated Equity
$1,551,145
Purchase Details
Closed on
Sep 10, 1997
Sold by
Stossel John W and Stossel Lisa A
Bought by
Vogel Kurt C
Home Financials for this Owner
Home Financials are based on the most recent Mortgage that was taken out on this home.
Original Mortgage
$236,400
Interest Rate
7.37%
Purchase Details
Closed on
Nov 17, 1993
Sold by
Stossel John W and Olmetti Lisa A
Bought by
Stossel John W and Stossel Lisa A
Home Financials for this Owner
Home Financials are based on the most recent Mortgage that was taken out on this home.
Original Mortgage
$26,000
Interest Rate
6.85%
Create a Home Valuation Report for This Property
The Home Valuation Report is an in-depth analysis detailing your home's value as well as a comparison with similar homes in the area
Home Values in the Area
Average Home Value in this Area
Purchase History
| Date | Buyer | Sale Price | Title Company |
|---|---|---|---|
| Lei Jing | $566,000 | Stewart Title | |
| Vogel Kurt C | $295,500 | All Cal Title Company | |
| Stossel John W | -- | -- |
Source: Public Records
Mortgage History
| Date | Status | Borrower | Loan Amount |
|---|---|---|---|
| Open | Lei Jing | $449,400 | |
| Previous Owner | Vogel Kurt C | $236,400 | |
| Previous Owner | Stossel John W | $26,000 | |
| Closed | Lei Jing | $60,000 |
Source: Public Records
Tax History Compared to Growth
Tax History
| Year | Tax Paid | Tax Assessment Tax Assessment Total Assessment is a certain percentage of the fair market value that is determined by local assessors to be the total taxable value of land and additions on the property. | Land | Improvement |
|---|---|---|---|---|
| 2025 | $10,993 | $852,475 | $383,481 | $468,994 |
| 2024 | $10,993 | $835,761 | $375,962 | $459,799 |
| 2023 | $10,842 | $819,375 | $368,591 | $450,784 |
| 2022 | $10,788 | $803,310 | $361,364 | $441,946 |
| 2021 | $10,587 | $787,560 | $354,279 | $433,281 |
| 2020 | $10,309 | $779,486 | $350,647 | $428,839 |
| 2019 | $10,158 | $764,203 | $343,772 | $420,431 |
| 2018 | $9,840 | $749,220 | $337,032 | $412,188 |
| 2017 | $9,695 | $734,530 | $330,424 | $404,106 |
| 2016 | $9,114 | $720,129 | $323,946 | $396,183 |
| 2015 | $8,955 | $709,313 | $319,081 | $390,232 |
| 2014 | $8,630 | $695,419 | $312,831 | $382,588 |
Source: Public Records
Map
Nearby Homes
- 1170 Steinway Ave
- 1097-1099 W Hacienda Ave
- 915 Bucknam Ave
- 615 Chapman Dr
- 1162 Capri Dr
- 14145 Capri Dr
- 1152 Capri Dr
- 668 W Sunnyoaks Ave
- 101 Peach Willow Ct
- 440 W Hacienda Ave
- 614 Beta Ct
- 207 Palmer Dr
- 1329 Elam Ave
- 816 Waldo Rd
- 107 Naramore Ln
- 14225 Lora Dr Unit 90
- 14225 Lora Dr Unit 36
- 14225 Lora Dr Unit 70
- 875 Emory Ave
- 112 Mozart Ave