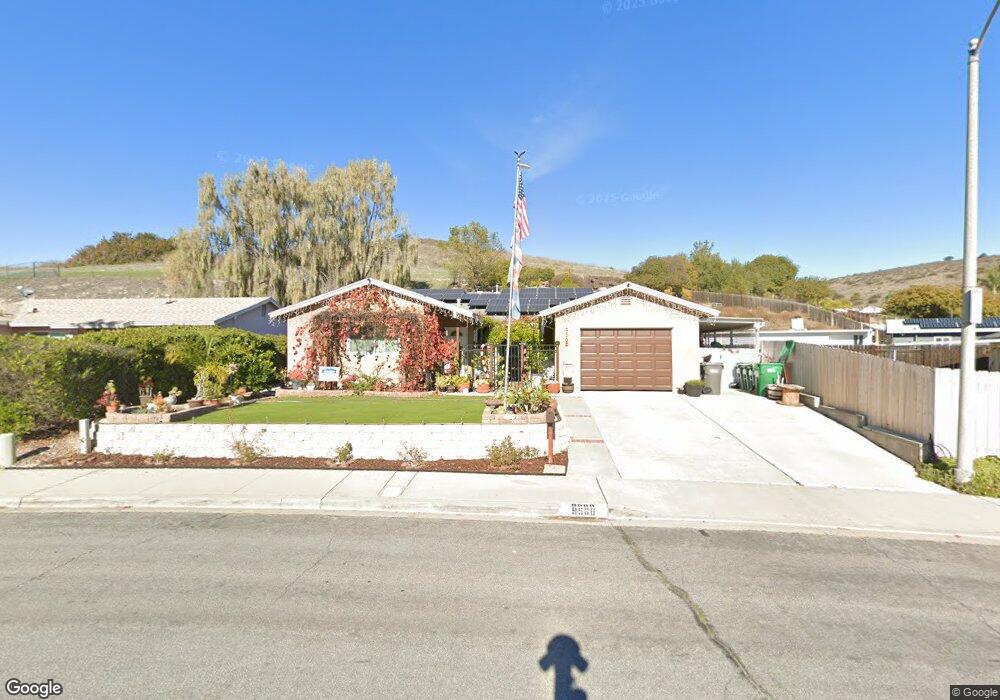
9568 Tuthill Way Santee, CA 92071
Carlton Hills NeighborhoodEstimated Value: $863,000 - $925,000
4
Beds
2
Baths
1,821
Sq Ft
$486/Sq Ft
Est. Value
About This Home
This home is located at 9568 Tuthill Way, Santee, CA 92071 and is currently estimated at $885,430, approximately $486 per square foot. 9568 Tuthill Way is a home located in San Diego County with nearby schools including Sycamore Canyon Elementary School and West Hills High School.
Ownership History
Date
Name
Owned For
Owner Type
Purchase Details
Closed on
Mar 7, 2018
Sold by
Pires Michael J and Pires Kristy D
Bought by
Bleichwehl Andrew P and Bleichwehl Barbara J
Current Estimated Value
Home Financials for this Owner
Home Financials are based on the most recent Mortgage that was taken out on this home.
Original Mortgage
$602,685
Outstanding Balance
$516,453
Interest Rate
4.38%
Mortgage Type
VA
Estimated Equity
$368,977
Purchase Details
Closed on
Oct 24, 2014
Sold by
The Gary L Canfield & Geraldine C Canfie and Canfield Gary L
Bought by
Pires Michael J and Pires Kristy D
Home Financials for this Owner
Home Financials are based on the most recent Mortgage that was taken out on this home.
Original Mortgage
$422,212
Interest Rate
4.17%
Mortgage Type
VA
Purchase Details
Closed on
Sep 15, 2012
Sold by
Canfield Gary and Canfield Gerry
Bought by
Canfield Gary L and Geraldine C Canfield R
Purchase Details
Closed on
Jun 29, 1984
Bought by
Canfield Gary Gerry
Create a Home Valuation Report for This Property
The Home Valuation Report is an in-depth analysis detailing your home's value as well as a comparison with similar homes in the area
Home Values in the Area
Average Home Value in this Area
Purchase History
| Date | Buyer | Sale Price | Title Company |
|---|---|---|---|
| Bleichwehl Andrew P | $590,000 | Stewart Title Of California | |
| Pires Michael J | $475,000 | Fidelity National Title | |
| Canfield Gary L | -- | None Available | |
| Canfield Gary Gerry | $77,300 | -- |
Source: Public Records
Mortgage History
| Date | Status | Borrower | Loan Amount |
|---|---|---|---|
| Open | Bleichwehl Andrew P | $602,685 | |
| Previous Owner | Pires Michael J | $422,212 |
Source: Public Records
Tax History
| Year | Tax Paid | Tax Assessment Tax Assessment Total Assessment is a certain percentage of the fair market value that is determined by local assessors to be the total taxable value of land and additions on the property. | Land | Improvement |
|---|---|---|---|---|
| 2025 | $7,857 | $671,312 | $164,655 | $506,657 |
| 2024 | $7,857 | $658,150 | $161,427 | $496,723 |
| 2023 | $7,616 | $645,246 | $158,262 | $486,984 |
| 2022 | $7,561 | $632,595 | $155,159 | $477,436 |
| 2021 | $7,458 | $620,192 | $152,117 | $468,075 |
| 2020 | $7,364 | $613,834 | $150,558 | $463,276 |
| 2019 | $7,103 | $601,799 | $147,606 | $454,193 |
| 2018 | $5,925 | $501,723 | $123,060 | $378,663 |
| 2017 | $5,846 | $491,887 | $120,648 | $371,239 |
| 2016 | $5,668 | $482,243 | $118,283 | $363,960 |
| 2015 | $5,591 | $475,000 | $116,507 | $358,493 |
| 2014 | $2,478 | $208,163 | $51,058 | $157,105 |
Source: Public Records
Map
Nearby Homes
- 9909 Halberns Blvd
- 9722 Roe Dr
- 9931 Beck Dr
- 9656 Domer Rd
- 10118 Swanton Dr
- 9410 Pike Rd
- 9409 Pike Rd
- 405 Whispering Willow Dr Unit E
- 9649 Derald Rd
- 9942 Theresa Ln
- 0 River Park Dr Unit na
- 10158 Carefree Dr
- 9829 Caspi Gardens Dr Unit 6
- 10185 Peaceful Ct Unit 64B2
- 10143 Maple Tree Rd
- 9941 Woodpark Dr
- 9213 Fenway Rd
- 10337 Strathmore Dr
- 9209 Arnaz Way
- 10012 Shaggybark Dr
- 9562 Tuthill Way
- 9630 Cecilwood Dr
- 9626 Cecilwood Dr
- 9556 Tuthill Way
- 9634 Cecilwood Dr
- 9550 Tuthill Way
- 9571 Tuthill Way
- 9565 Tuthill Way
- 9638 Cecilwood Dr
- 9544 Tuthill Way
- 9559 Tuthill Way
- 9644 Cecilwood Dr
- 9627 Cecilwood Dr
- 9553 Tuthill Way
- 9614 Cecilwood Dr
- 9631 Cecilwood Dr
- 9538 Tuthill Way
- 9623 Cecilwood Dr
- 9547 Tuthill Way
- 9650 Cecilwood Dr
Your Personal Tour Guide
Ask me questions while you tour the home.