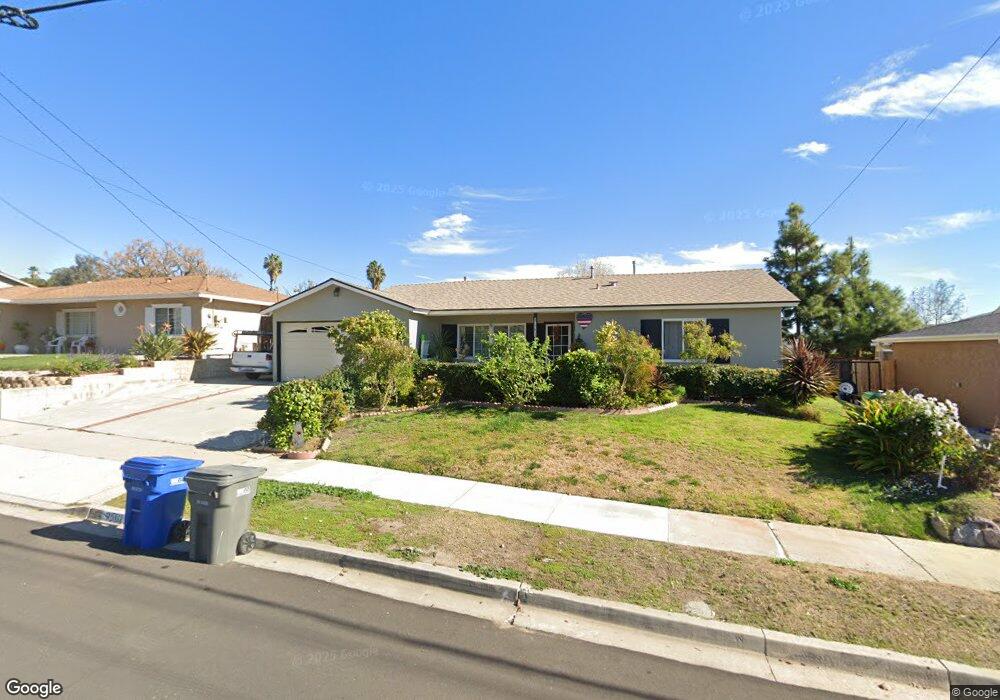
9581 Cambury Dr Santee, CA 92071
Carlton Hills NeighborhoodEstimated Value: $734,900 - $823,000
3
Beds
2
Baths
1,092
Sq Ft
$720/Sq Ft
Est. Value
About This Home
This home is located at 9581 Cambury Dr, Santee, CA 92071 and is currently estimated at $786,225, approximately $719 per square foot. 9581 Cambury Dr is a home located in San Diego County with nearby schools including Rio Seco Elementary School and West Hills High School.
Ownership History
Date
Name
Owned For
Owner Type
Purchase Details
Closed on
Jan 29, 2019
Sold by
Pires Ferreira Jose Carvalheira and Pires Ferreira Ana
Bought by
Pires Ferreira Jose Carvalheira and Pires Ferreira Ana
Current Estimated Value
Purchase Details
Closed on
Jun 27, 2006
Sold by
Ferreira Anna P
Bought by
Ferreira Joseph C
Home Financials for this Owner
Home Financials are based on the most recent Mortgage that was taken out on this home.
Original Mortgage
$200,000
Outstanding Balance
$118,604
Interest Rate
6.63%
Mortgage Type
New Conventional
Estimated Equity
$667,621
Purchase Details
Closed on
Mar 14, 1994
Sold by
Ferreira Joseph C and Ferreira Ana P
Bought by
Ferreira Joseph C and Ferreira Ana P
Home Financials for this Owner
Home Financials are based on the most recent Mortgage that was taken out on this home.
Original Mortgage
$105,000
Interest Rate
7.21%
Create a Home Valuation Report for This Property
The Home Valuation Report is an in-depth analysis detailing your home's value as well as a comparison with similar homes in the area
Home Values in the Area
Average Home Value in this Area
Purchase History
| Date | Buyer | Sale Price | Title Company |
|---|---|---|---|
| Pires Ferreira Jose Carvalheira | -- | None Available | |
| Ferreira Joseph C | -- | Financial Title | |
| Ferreira Joseph C | -- | Stewart Title Co |
Source: Public Records
Mortgage History
| Date | Status | Borrower | Loan Amount |
|---|---|---|---|
| Open | Ferreira Joseph C | $200,000 | |
| Closed | Ferreira Joseph C | $105,000 |
Source: Public Records
Tax History
| Year | Tax Paid | Tax Assessment Tax Assessment Total Assessment is a certain percentage of the fair market value that is determined by local assessors to be the total taxable value of land and additions on the property. | Land | Improvement |
|---|---|---|---|---|
| 2025 | $1,736 | $135,845 | $61,129 | $74,716 |
| 2024 | $1,736 | $133,182 | $59,931 | $73,251 |
| 2023 | $1,683 | $130,571 | $58,756 | $71,815 |
| 2022 | $1,667 | $128,011 | $57,604 | $70,407 |
| 2021 | $1,643 | $125,502 | $56,475 | $69,027 |
| 2020 | $1,623 | $124,216 | $55,896 | $68,320 |
| 2019 | $1,569 | $121,781 | $54,800 | $66,981 |
| 2018 | $1,538 | $119,394 | $53,726 | $65,668 |
| 2017 | $160 | $117,054 | $52,673 | $64,381 |
| 2016 | $1,472 | $114,760 | $51,641 | $63,119 |
| 2015 | $1,453 | $113,037 | $50,866 | $62,171 |
| 2014 | $1,426 | $110,824 | $49,870 | $60,954 |
Source: Public Records
Map
Nearby Homes
- 405 Whispering Willow Dr Unit E
- 10103 Little Leaf Ln
- 9722 Roe Dr
- 9942 Theresa Ln
- 9542 Markwood Dr
- 9837 Caspi Gardens Dr
- 9821 Caspi Gardens Dr Unit 8
- 9829 Caspi Gardens Dr Unit 6
- 317 Brookside Way
- 328 Paddle Ct
- 313 Brookside Way
- 9462 Doheny Rd
- 429 Lake Shore Way
- 10152 Peaceful Ct Unit 50B4
- 10135 Peaceful Ct
- 9401 Carlton Oaks Dr Unit E
- 10366 Rochelle Ave
- 9409 Pike Rd
- 10190 Palm Glen Dr Unit 62
- 10170 Palm Glen Dr Unit 46
- 9575 Cambury Dr
- 9605 Cambury Dr
- 9569 Cambury Dr
- 9611 Cambury Dr
- 9576 Cambury Dr
- 9608 Cambury Dr
- 9570 Cambury Dr
- 9563 Cambury Dr
- 9617 Cambury Dr
- 9564 Cambury Dr
- 9614 Cambury Dr
- 9578 Nyler Ct
- 9600 Cuyamaca St
- 9530 9530 CuyaMacA
- 9530 9530 CuyaMacA #102 & 101
- 9530 9530 CuyaMacA St # 102
- 9560 9560 CuyaMacA
- 9570 9570 CuyaMacA St #103
- 9570 Cuyamaca St
- 9530 Cuyamaca St Unit 102
Your Personal Tour Guide
Ask me questions while you tour the home.