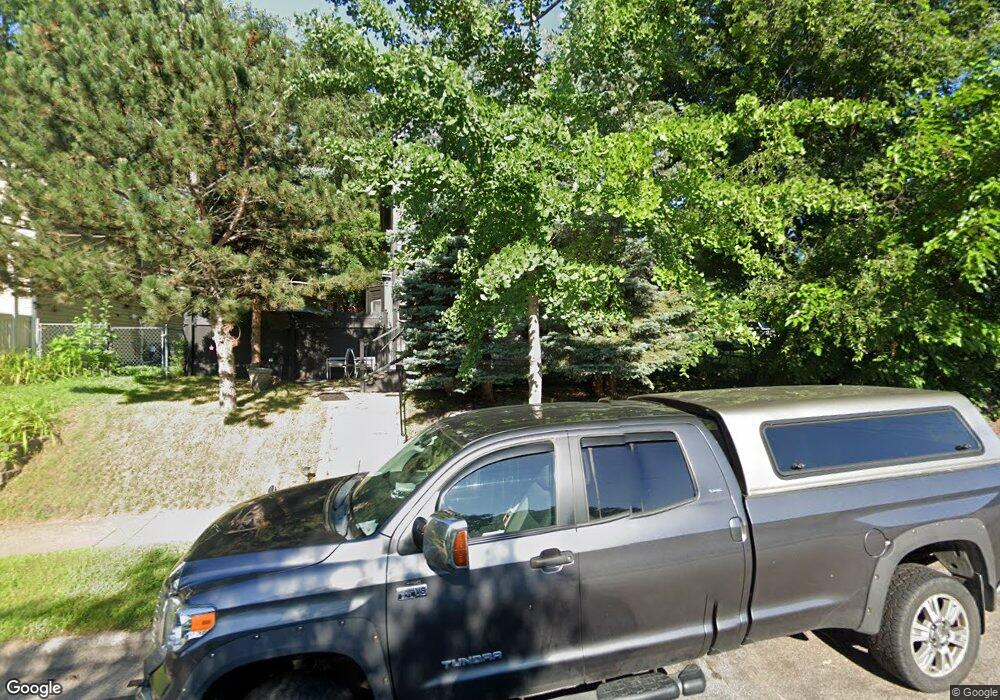
983 Agate St Saint Paul, MN 55117
North End NeighborhoodEstimated Value: $221,000 - $290,000
4
Beds
2
Baths
1,584
Sq Ft
$161/Sq Ft
Est. Value
About This Home
This home is located at 983 Agate St, Saint Paul, MN 55117 and is currently estimated at $255,034, approximately $161 per square foot. 983 Agate St is a home located in Ramsey County with nearby schools including Bruce F Vento Elementary School, Washington Technology Magnet School, and Creative Arts Secondary School.
Ownership History
Date
Name
Owned For
Owner Type
Purchase Details
Closed on
Jun 29, 2022
Sold by
Sorum Holding Inc A Minnesota Corpora
Bought by
Goble Justin and Goble Nancy
Current Estimated Value
Home Financials for this Owner
Home Financials are based on the most recent Mortgage that was taken out on this home.
Original Mortgage
$232,000
Outstanding Balance
$221,025
Interest Rate
5.25%
Mortgage Type
New Conventional
Estimated Equity
$34,009
Purchase Details
Closed on
May 4, 2021
Sold by
Sorum Scott L and Sorum Briony
Bought by
Sorum Holdings Inc
Purchase Details
Closed on
Mar 8, 2002
Sold by
Rodriguez Lucy J
Bought by
Arreguin Martha
Create a Home Valuation Report for This Property
The Home Valuation Report is an in-depth analysis detailing your home's value as well as a comparison with similar homes in the area
Home Values in the Area
Average Home Value in this Area
Purchase History
| Date | Buyer | Sale Price | Title Company |
|---|---|---|---|
| Goble Justin | $234,000 | -- | |
| Sorum Holdings Inc | -- | Land Title Inc | |
| Arreguin Martha | $75,000 | -- |
Source: Public Records
Mortgage History
| Date | Status | Borrower | Loan Amount |
|---|---|---|---|
| Open | Goble Justin | $232,000 |
Source: Public Records
Tax History Compared to Growth
Tax History
| Year | Tax Paid | Tax Assessment Tax Assessment Total Assessment is a certain percentage of the fair market value that is determined by local assessors to be the total taxable value of land and additions on the property. | Land | Improvement |
|---|---|---|---|---|
| 2025 | $3,948 | $253,300 | $25,000 | $228,300 |
| 2023 | $3,948 | $215,600 | $20,000 | $195,600 |
| 2022 | $2,620 | $169,300 | $20,000 | $149,300 |
| 2021 | $2,398 | $149,000 | $20,000 | $129,000 |
| 2020 | $2,658 | $140,400 | $9,900 | $130,500 |
| 2019 | $2,060 | $146,100 | $9,900 | $136,200 |
| 2018 | $1,982 | $109,200 | $9,900 | $99,300 |
| 2017 | $1,782 | $102,300 | $9,900 | $92,400 |
| 2016 | $1,568 | $0 | $0 | $0 |
| 2015 | $1,854 | $76,500 | $9,900 | $66,600 |
| 2014 | $1,534 | $0 | $0 | $0 |
Source: Public Records
Map
Nearby Homes