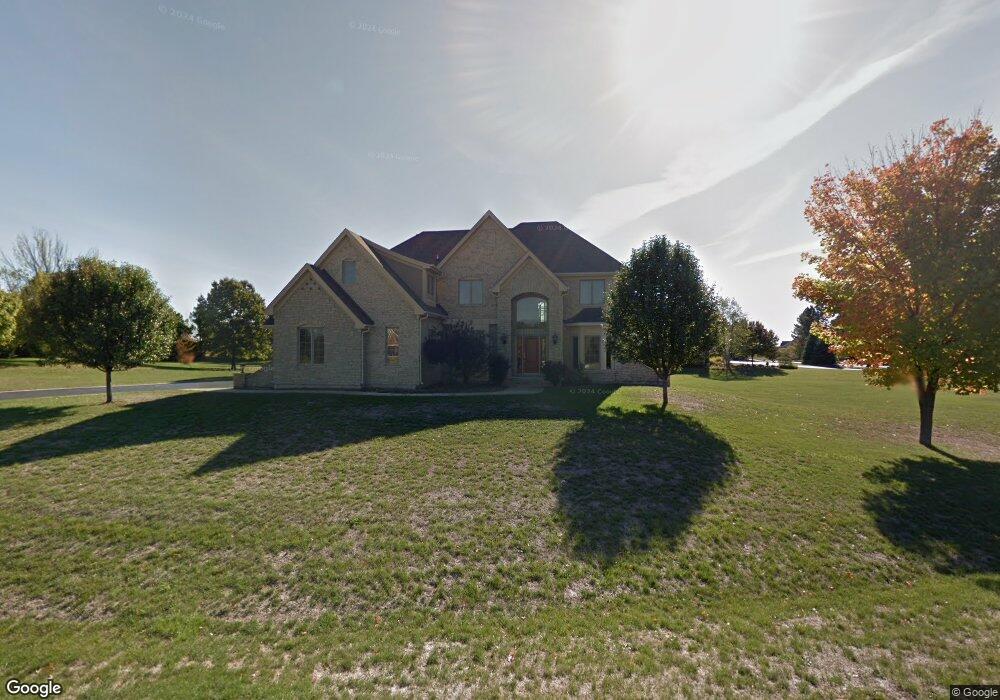
9n709 Whispering Springs Ln Elgin, IL 60124
Bowes NeighborhoodEstimated Value: $744,000 - $910,000
4
Beds
4
Baths
3,685
Sq Ft
$233/Sq Ft
Est. Value
About This Home
This home is located at 9n709 Whispering Springs Ln, Elgin, IL 60124 and is currently estimated at $857,070, approximately $232 per square foot. 9n709 Whispering Springs Ln is a home located in Kane County with nearby schools including Howard B. Thomas Grade School, Prairie Knolls Middle School, and Central Middle School.
Ownership History
Date
Name
Owned For
Owner Type
Purchase Details
Closed on
Nov 18, 2022
Sold by
Woolwine Steven and Woolwine Kelly
Bought by
Woolwine Family Living Trust and Woolwine
Current Estimated Value
Purchase Details
Closed on
Oct 6, 2021
Sold by
Johnson Erick R
Bought by
Woolwine Steven and Woolwine Kelly
Home Financials for this Owner
Home Financials are based on the most recent Mortgage that was taken out on this home.
Original Mortgage
$584,000
Interest Rate
2.99%
Mortgage Type
New Conventional
Purchase Details
Closed on
Apr 20, 2020
Sold by
Parkway Bank And Turst Company
Bought by
Johnson Erick R
Home Financials for this Owner
Home Financials are based on the most recent Mortgage that was taken out on this home.
Original Mortgage
$450,660
Interest Rate
2.25%
Mortgage Type
New Conventional
Purchase Details
Closed on
Dec 23, 2003
Sold by
Yurs Laura Helene
Bought by
Parkway Bank & Trust Co and Trust #13680
Create a Home Valuation Report for This Property
The Home Valuation Report is an in-depth analysis detailing your home's value as well as a comparison with similar homes in the area
Home Values in the Area
Average Home Value in this Area
Purchase History
| Date | Buyer | Sale Price | Title Company |
|---|---|---|---|
| Woolwine Family Living Trust | -- | Accommodation/Courtesy Recordi | |
| Woolwine Steven | $730,000 | Ct | |
| Johnson Erick R | $435,000 | None Available | |
| Parkway Bank & Trust Co | $110,000 | Fox Title Company |
Source: Public Records
Mortgage History
| Date | Status | Borrower | Loan Amount |
|---|---|---|---|
| Previous Owner | Woolwine Steven | $584,000 | |
| Previous Owner | Johnson Erick R | $450,660 |
Source: Public Records
Tax History Compared to Growth
Tax History
| Year | Tax Paid | Tax Assessment Tax Assessment Total Assessment is a certain percentage of the fair market value that is determined by local assessors to be the total taxable value of land and additions on the property. | Land | Improvement |
|---|---|---|---|---|
| 2024 | $18,804 | $252,068 | $31,322 | $220,746 |
| 2023 | $17,304 | $218,852 | $28,333 | $190,519 |
| 2022 | $16,303 | $188,529 | $24,917 | $163,612 |
| 2021 | $14,321 | $162,104 | $24,072 | $138,032 |
| 2020 | $14,836 | $159,190 | $23,639 | $135,551 |
| 2019 | $14,798 | $157,131 | $23,333 | $133,798 |
| 2018 | $14,490 | $154,357 | $24,107 | $130,250 |
| 2017 | $14,130 | $148,736 | $23,496 | $125,240 |
| 2016 | $14,968 | $145,208 | $22,939 | $122,269 |
| 2015 | -- | $145,208 | $22,939 | $122,269 |
| 2014 | -- | $135,374 | $22,939 | $112,435 |
| 2013 | -- | $140,848 | $23,331 | $117,517 |
Source: Public Records
Map
Nearby Homes
- 40W513 Old Mill Ct
- 9N954 Heatherington Place
- 4378 John Milton Rd
- 3870 Crooked Creek Dr
- 3848 Valhalla Dr
- 40W156 Sturbridge Way
- 3584 Tournament Dr
- 1210 Falcon Ridge Dr
- 9N601 Santa fe Trail
- 41W072 Bowes Rd
- 1127 Pine Valley Ct
- 3689 Thornhill Dr
- 1103 Championship Dr
- 335 Buffalo Dr
- 3591 Doral Dr
- 10N836 Lakeside Ct
- 312 Monument Rd
- 3539 Crosswater Ct
- 2 Stonecrest Dr
- 300 Monument Rd
- 9N709 Whispering Springs Ln
- Lot 10 Whispering Springs Ln
- Lot 8 Whispering Springs Ln
- 9N777 Whispering Springs Ln
- 9N675 Whispering Springs Ln
- 9N690 Whispering Springs Ln
- 9N724 Whispering Springs Ln
- 9N759 Whispering Springs Ln
- 9N768 Whispering Springs Ln
- 9N754 Whispering Springs Ln
- 9N668 Whispering Springs Ln Unit 2
- 9N766 Whispering Springs Ln
- 4085 Conifer Ct
- 4083 Conifer Ct
- 4087 Conifer Ct
- 4086 Conifer Ct
- 4077 Conifer Dr
- 4075 Conifer Dr
- 1075 Conifer Dr