
10 East St Unit 5 Providence, RI 02906
Fox Point Neighborhood
2
Beds
2.5
Baths
1,568
Sq Ft
$427/mo
HOA Fee
Highlights
- 0.23 Acre Lot
- Wood Flooring
- Public Transportation
- Cathedral Ceiling
- Bathtub with Shower
- 4-minute walk to Brassil Park
About This Home
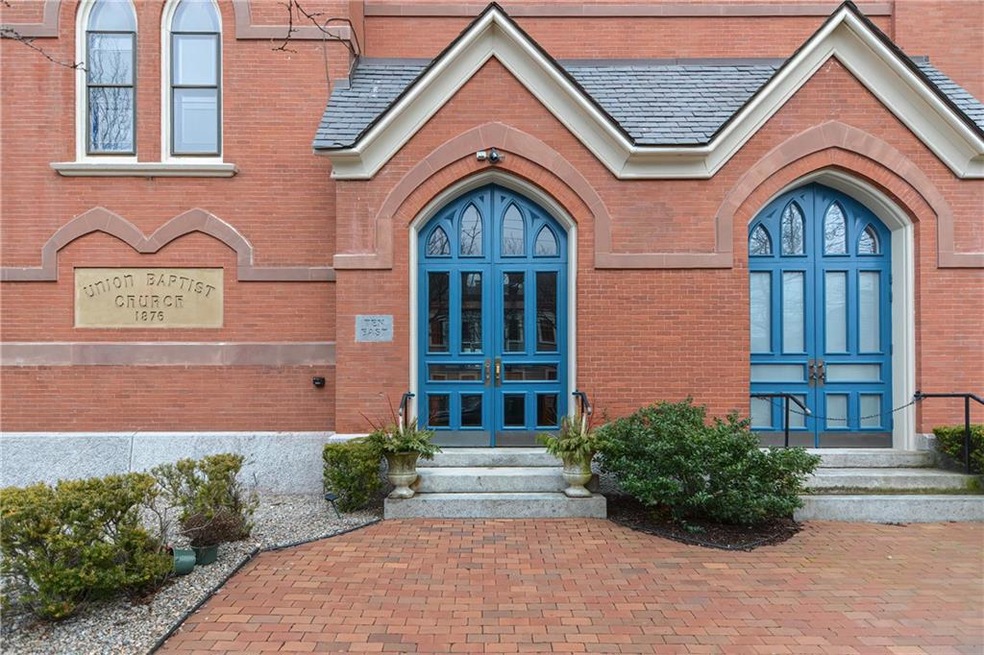
As of March 2023Welcome to East St Condos located in the heart of the East Side/Fox Point neighborhoods. Walk to coffee shops restaurants and shops. Super convenient to Brown and RISD. Experience the Late Gothic Revival character of the Union Baptist Church, circa 1876.
Dramatic open layout features towering windows with beautiful stained glass. The expansive staircase leads to a striking open office or sitting area with 4 amazing West facing windows with city views. Underground garage parking with elevator service.
Truly one not to be missed!
Property Details
Home Type
- Condominium
Est. Annual Taxes
- $5,423
Year Built
- Built in 1876
HOA Fees
- $427 Monthly HOA Fees
Parking
- 1 Car Garage
- Garage Door Opener
- Assigned Parking
Home Design
- Concrete Perimeter Foundation
- Masonry
- Plaster
Interior Spaces
- 1,568 Sq Ft Home
- 2-Story Property
- Cathedral Ceiling
- Interior and Exterior Basement Entry
Kitchen
- Oven
- Range with Range Hood
- Microwave
- Dishwasher
- Disposal
Flooring
- Wood
- Ceramic Tile
Bedrooms and Bathrooms
- 2 Bedrooms
- Bathtub with Shower
Laundry
- Laundry in unit
- Dryer
- Washer
Location
- Property near a hospital
Utilities
- Forced Air Heating and Cooling System
- Heat Pump System
- 100 Amp Service
- Gas Water Heater
- Cable TV Available
Listing and Financial Details
- Tax Lot 627
- Assessor Parcel Number 10EASTST5PROV
Community Details
Amenities
- Shops
- Public Transportation
Pet Policy
- Cats Allowed
Ownership History
Date
Name
Owned For
Owner Type
Purchase Details
Listed on
Mar 10, 2023
Closed on
Mar 28, 2023
Sold by
Estrada Jorge E
Bought by
Paul K K and Paul Susan H
Seller's Agent
Roseann Dugan
HomeSmart Professionals
Buyer's Agent
Pamela Hanson Carbone
Domain Properties
List Price
$615,900
Sold Price
$605,000
Premium/Discount to List
-$10,900
-1.77%
Total Days on Market
0
Views
3
Current Estimated Value
Home Financials for this Owner
Home Financials are based on the most recent Mortgage that was taken out on this home.
Estimated Appreciation
$85,680
Avg. Annual Appreciation
6.45%
Purchase Details
Listed on
Mar 15, 2022
Closed on
May 26, 2022
Sold by
Jentzsch Stefan J
Bought by
Estrada Jorge E
Seller's Agent
Gerri Schiffman
Residential Properties Ltd.
Buyer's Agent
Roseann Dugan
HomeSmart Professionals
List Price
$535,000
Sold Price
$575,000
Premium/Discount to List
$40,000
7.48%
Home Financials for this Owner
Home Financials are based on the most recent Mortgage that was taken out on this home.
Avg. Annual Appreciation
6.17%
Original Mortgage
$517,500
Interest Rate
4.63%
Mortgage Type
Purchase Money Mortgage
Purchase Details
Listed on
Mar 15, 2022
Closed on
May 24, 2022
Sold by
Jentzsch Maximilian S and Jentzsch Stefan J
Bought by
Jentzsch Stefan J
Seller's Agent
Gerri Schiffman
Residential Properties Ltd.
Buyer's Agent
Roseann Dugan
HomeSmart Professionals
List Price
$535,000
Sold Price
$575,000
Premium/Discount to List
$40,000
7.48%
Home Financials for this Owner
Home Financials are based on the most recent Mortgage that was taken out on this home.
Original Mortgage
$517,500
Interest Rate
4.63%
Mortgage Type
Purchase Money Mortgage
Purchase Details
Listed on
Aug 1, 2018
Closed on
Aug 2, 2018
Sold by
Valicenti James F and Valicenti Adrienne M
Bought by
Jentzsch Stefan J and Jentzch Maximilian S
Seller's Agent
Joshua Cullion
Mott & Chace Sotheby's Intl.
Buyer's Agent
Stephen Perrino
Paiva Realty Group
List Price
$428,000
Sold Price
$428,000
Home Financials for this Owner
Home Financials are based on the most recent Mortgage that was taken out on this home.
Avg. Annual Appreciation
8.04%
Purchase Details
Closed on
Feb 15, 2006
Sold by
Kenney Karen M
Bought by
Crimmins Nancy
Home Financials for this Owner
Home Financials are based on the most recent Mortgage that was taken out on this home.
Original Mortgage
$417,000
Interest Rate
6.23%
Mortgage Type
Purchase Money Mortgage
Purchase Details
Closed on
Sep 30, 2004
Sold by
Blair Margaret H
Bought by
Kenney Karen M
Home Financials for this Owner
Home Financials are based on the most recent Mortgage that was taken out on this home.
Original Mortgage
$150,000
Interest Rate
5.81%
Mortgage Type
Purchase Money Mortgage
Purchase Details
Closed on
Dec 2, 1999
Sold by
Bettencourt C T
Bought by
Blair Margaret H and Blair Francis I
Purchase Details
Closed on
May 13, 1996
Sold by
Hedstrom James C
Bought by
Bettencourt Christophe
Home Financials for this Owner
Home Financials are based on the most recent Mortgage that was taken out on this home.
Original Mortgage
$142,000
Interest Rate
7.67%
Purchase Details
Closed on
Jun 30, 1995
Sold by
Abbott David R and Abbott Linda
Bought by
Hedstrom James C
Map
Create a Home Valuation Report for This Property
The Home Valuation Report is an in-depth analysis detailing your home's value as well as a comparison with similar homes in the area
Similar Homes in Providence, RI
Home Values in the Area
Average Home Value in this Area
Purchase History
| Date | Type | Sale Price | Title Company |
|---|---|---|---|
| Warranty Deed | $605,000 | None Available | |
| Warranty Deed | $575,000 | None Available | |
| Warranty Deed | -- | None Available | |
| Warranty Deed | $428,000 | -- | |
| Deed | $47,000 | -- | |
| Deed | $400,000 | -- | |
| Warranty Deed | $215,000 | -- | |
| Warranty Deed | $150,000 | -- | |
| Warranty Deed | $150,000 | -- |
Source: Public Records
Mortgage History
| Date | Status | Loan Amount | Loan Type |
|---|---|---|---|
| Previous Owner | $517,500 | Purchase Money Mortgage | |
| Previous Owner | $100,000 | No Value Available | |
| Previous Owner | $417,000 | Purchase Money Mortgage | |
| Previous Owner | $150,000 | Purchase Money Mortgage | |
| Previous Owner | $142,000 | No Value Available |
Source: Public Records
Property History
| Date | Event | Price | Change | Sq Ft Price |
|---|---|---|---|---|
| 03/31/2023 03/31/23 | Sold | $605,000 | -1.8% | $386 / Sq Ft |
| 03/10/2023 03/10/23 | Pending | -- | -- | -- |
| 03/10/2023 03/10/23 | For Sale | $615,900 | +7.1% | $393 / Sq Ft |
| 05/26/2022 05/26/22 | Sold | $575,000 | +7.5% | $366 / Sq Ft |
| 03/22/2022 03/22/22 | Pending | -- | -- | -- |
| 03/15/2022 03/15/22 | For Sale | $535,000 | +25.0% | $341 / Sq Ft |
| 08/01/2018 08/01/18 | Sold | $428,000 | 0.0% | $276 / Sq Ft |
| 08/01/2018 08/01/18 | For Sale | $428,000 | -- | $276 / Sq Ft |
Source: State-Wide MLS
Tax History
| Year | Tax Paid | Tax Assessment Tax Assessment Total Assessment is a certain percentage of the fair market value that is determined by local assessors to be the total taxable value of land and additions on the property. | Land | Improvement |
|---|---|---|---|---|
| 2024 | $10,164 | $553,900 | $0 | $553,900 |
| 2023 | $10,164 | $553,900 | $0 | $553,900 |
| 2022 | $9,859 | $553,900 | $0 | $553,900 |
| 2021 | $9,888 | $402,600 | $0 | $402,600 |
| 2020 | $9,888 | $402,600 | $0 | $402,600 |
| 2019 | $9,888 | $402,600 | $0 | $402,600 |
| 2018 | $10,266 | $321,200 | $0 | $321,200 |
| 2017 | $10,266 | $321,200 | $0 | $321,200 |
| 2016 | $10,266 | $321,200 | $0 | $321,200 |
| 2015 | $11,529 | $348,300 | $0 | $348,300 |
| 2014 | $11,755 | $348,300 | $0 | $348,300 |
| 2013 | $11,755 | $348,300 | $0 | $348,300 |
Source: Public Records
Source: State-Wide MLS
MLS Number: 1331224
APN: PROV-170627-000000-000005
Disclaimer: Certain information contained herein is derived from information provided by parties other than Homes.com. All information provided is deemed reliable, but is not guaranteed to be accurate and should be independently verified.
![]() IDX information is provided exclusively for personal, non-commercial use, and may not be used for any purpose other than to identify prospective properties consumers may be interested in purchasing. Information is deemed reliable but not guaranteed.
IDX information is provided exclusively for personal, non-commercial use, and may not be used for any purpose other than to identify prospective properties consumers may be interested in purchasing. Information is deemed reliable but not guaranteed.
Copyright © 2025 State-Wide MLS, Inc. All rights reserved.
Nearby Homes
- 85 John St
- 109 Hope St
- 57 Armstrong Ave
- 17 Thayer St
- 96 Gano St Unit 6
- 67 Manning St
- 46 Sheldon St
- 67 E Manning St
- 87 Cooke St Unit 2
- 101 E Manning St
- 555 S Water St Unit 329
- 555 S Water St Unit 211
- 206 Waterman St Unit 2
- 279 Benefit St Unit 3
- 51 Arlington Ave Unit B
- 277 Waterman St
- 23 S Angell St Unit 6
- 270 Waterman St Unit C
- 47 S Angell St
- 214 Bowen St