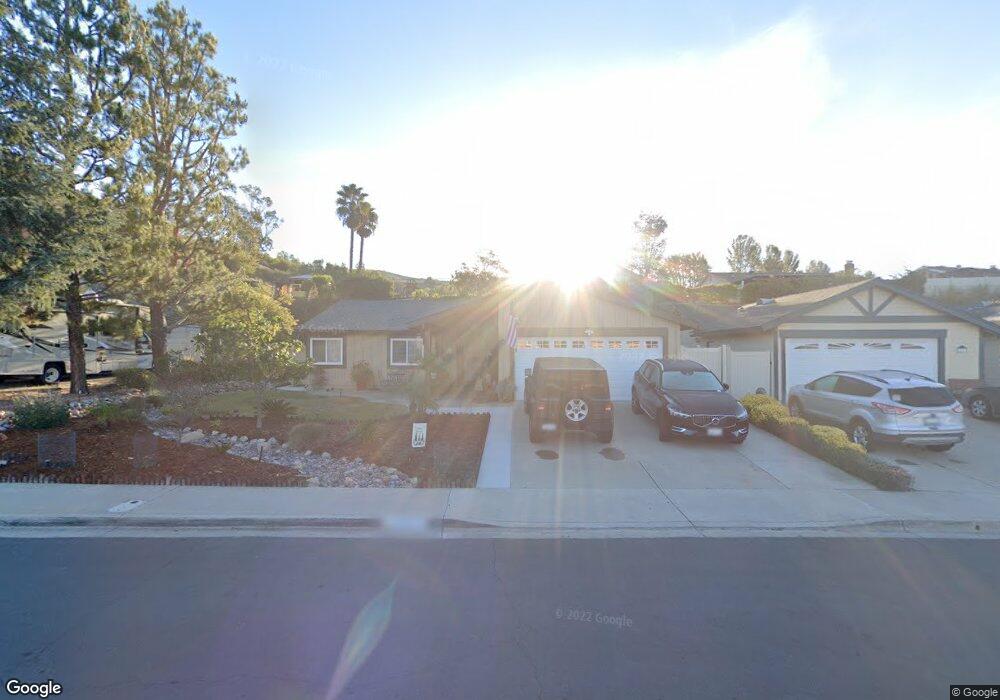
10377 Settle Rd Santee, CA 92071
Carlton Hills NeighborhoodEstimated Value: $921,471 - $982,000
3
Beds
2
Baths
1,767
Sq Ft
$531/Sq Ft
Est. Value
About This Home
This home is located at 10377 Settle Rd, Santee, CA 92071 and is currently estimated at $938,868, approximately $531 per square foot. 10377 Settle Rd is a home located in San Diego County with nearby schools including Sycamore Canyon Elementary School and West Hills High School.
Ownership History
Date
Name
Owned For
Owner Type
Purchase Details
Closed on
Apr 9, 2021
Sold by
Johnson Corrine M and Johnson Charles K
Bought by
Johnson Charles K and Johnson Corrine M
Current Estimated Value
Home Financials for this Owner
Home Financials are based on the most recent Mortgage that was taken out on this home.
Original Mortgage
$438,000
Outstanding Balance
$395,461
Interest Rate
3%
Mortgage Type
New Conventional
Estimated Equity
$543,407
Purchase Details
Closed on
Jul 22, 2016
Sold by
Johnson Charles K and Johnson Corrine M
Bought by
Johnson Charles K and Johnson Corrine M
Home Financials for this Owner
Home Financials are based on the most recent Mortgage that was taken out on this home.
Original Mortgage
$423,788
Interest Rate
3.54%
Mortgage Type
FHA
Purchase Details
Closed on
Sep 21, 2005
Sold by
Johnson Charles K and Johnson Corrine M
Bought by
Johnson Charles K and Johnson Corrine M
Home Financials for this Owner
Home Financials are based on the most recent Mortgage that was taken out on this home.
Original Mortgage
$428,000
Interest Rate
6%
Mortgage Type
New Conventional
Purchase Details
Closed on
Jun 3, 2005
Sold by
Johnson Charles K and Johnson Corrine M
Bought by
Johnson Charles K and Johnson Corrine M
Purchase Details
Closed on
Feb 12, 2004
Sold by
Johnson Charles K and Johnson Corrine M
Bought by
Johnson Charles K and Johnson Corrine M
Home Financials for this Owner
Home Financials are based on the most recent Mortgage that was taken out on this home.
Original Mortgage
$356,000
Interest Rate
5.85%
Mortgage Type
Stand Alone Refi Refinance Of Original Loan
Purchase Details
Closed on
Oct 2, 2002
Sold by
Prudential Relocation Inc
Bought by
Johnson Charles K and Johnson Corrine M
Home Financials for this Owner
Home Financials are based on the most recent Mortgage that was taken out on this home.
Original Mortgage
$282,800
Interest Rate
6.17%
Purchase Details
Closed on
Jan 31, 2002
Sold by
Fiebig Robert A and Fiebig Susan E
Bought by
Fiebig Robert A and Fiebig Susan E
Purchase Details
Closed on
Jan 21, 1997
Sold by
Ray and Rebecca
Bought by
Fiebig Robert A and Fiebig Susan
Home Financials for this Owner
Home Financials are based on the most recent Mortgage that was taken out on this home.
Original Mortgage
$141,475
Interest Rate
7.86%
Purchase Details
Closed on
Feb 25, 1987
Purchase Details
Closed on
Jan 25, 1984
Create a Home Valuation Report for This Property
The Home Valuation Report is an in-depth analysis detailing your home's value as well as a comparison with similar homes in the area
Home Values in the Area
Average Home Value in this Area
Purchase History
| Date | Buyer | Sale Price | Title Company |
|---|---|---|---|
| Johnson Charles K | -- | Accommodation | |
| Johnson Corrine M | -- | Wfg Title Co Of Ca San Diego | |
| Johnson Charles K | -- | Ticor Title San Diego | |
| Johnson Charles K | -- | Ticor Title San Diego | |
| Johnson Charles K | -- | -- | |
| Johnson Charles K | -- | Fidelity National Title | |
| Johnson Charles K | -- | -- | |
| Johnson Charles K | -- | Fidelity National Title Co | |
| Johnson Charles K | $354,000 | Fidelity National Title | |
| Prudential Relocation Inc | -- | Fidelity National Title | |
| Fiebig Robert A | -- | -- | |
| Fiebig Robert A | $161,500 | Stewart Title Co | |
| -- | $110,900 | -- | |
| -- | $98,500 | -- |
Source: Public Records
Mortgage History
| Date | Status | Borrower | Loan Amount |
|---|---|---|---|
| Open | Johnson Corrine M | $438,000 | |
| Closed | Johnson Charles K | $423,788 | |
| Closed | Johnson Charles K | $428,000 | |
| Closed | Johnson Charles K | $356,000 | |
| Closed | Johnson Charles K | $282,800 | |
| Previous Owner | Fiebig Robert A | $141,475 | |
| Closed | Johnson Charles K | $35,350 |
Source: Public Records
Tax History
| Year | Tax Paid | Tax Assessment Tax Assessment Total Assessment is a certain percentage of the fair market value that is determined by local assessors to be the total taxable value of land and additions on the property. | Land | Improvement |
|---|---|---|---|---|
| 2025 | $6,011 | $511,964 | $217,240 | $294,724 |
| 2024 | $6,011 | $501,927 | $212,981 | $288,946 |
| 2023 | $5,826 | $492,086 | $208,805 | $283,281 |
| 2022 | $5,783 | $482,438 | $204,711 | $277,727 |
| 2021 | $5,702 | $472,980 | $200,698 | $272,282 |
| 2020 | $5,631 | $468,132 | $198,641 | $269,491 |
| 2019 | $5,432 | $458,954 | $194,747 | $264,207 |
| 2018 | $5,319 | $449,956 | $190,929 | $259,027 |
| 2017 | $5,249 | $441,135 | $187,186 | $253,949 |
| 2016 | $5,089 | $432,486 | $183,516 | $248,970 |
| 2015 | $4,892 | $415,000 | $175,000 | $240,000 |
| 2014 | $4,595 | $390,000 | $165,000 | $225,000 |
Source: Public Records
Map
Nearby Homes
- 10354 Settle Rd
- 9213 Fenway Rd
- 10504 Strathmore Dr
- 10118 Swanton Dr
- 9542 Markwood Dr
- 9649 Derald Rd
- 9722 Roe Dr
- 9462 Doheny Rd
- 8810 Wigwam Ct
- 8514 Boulder Way
- 9410 Pike Rd
- 9243 Stoyer Dr
- 9409 Pike Rd
- 10634 Sanfred Ct
- 9401 Carlton Oaks Dr Unit E
- 0 Summit Crest Dr Unit 17/11
- 10621 Keith St
- 9942 Theresa Ln
- 405 Whispering Willow Dr Unit E
- 10143 Maple Tree Rd
- 10371 Settle Rd
- 9378 Remuda Ct
- 9372 Remuda Ct
- 10365 Settle Rd
- 9384 Remuda Ct
- 10374 Settle Rd
- 9352 Remuda Ct
- 10368 Settle Rd
- 10359 Settle Rd
- 10362 Settle Rd
- 9385 Remuda Ct
- 9377 Remuda Ct
- 10369 Cadwell Rd
- 10363 Cadwell Rd
- 10405 Cadwell Rd
- 9369 Remuda Ct
- 9353 Remuda Ct
- 10337 Settle Rd
- 9361 Remuda Ct
- 10357 Cadwell Rd
Your Personal Tour Guide
Ask me questions while you tour the home.