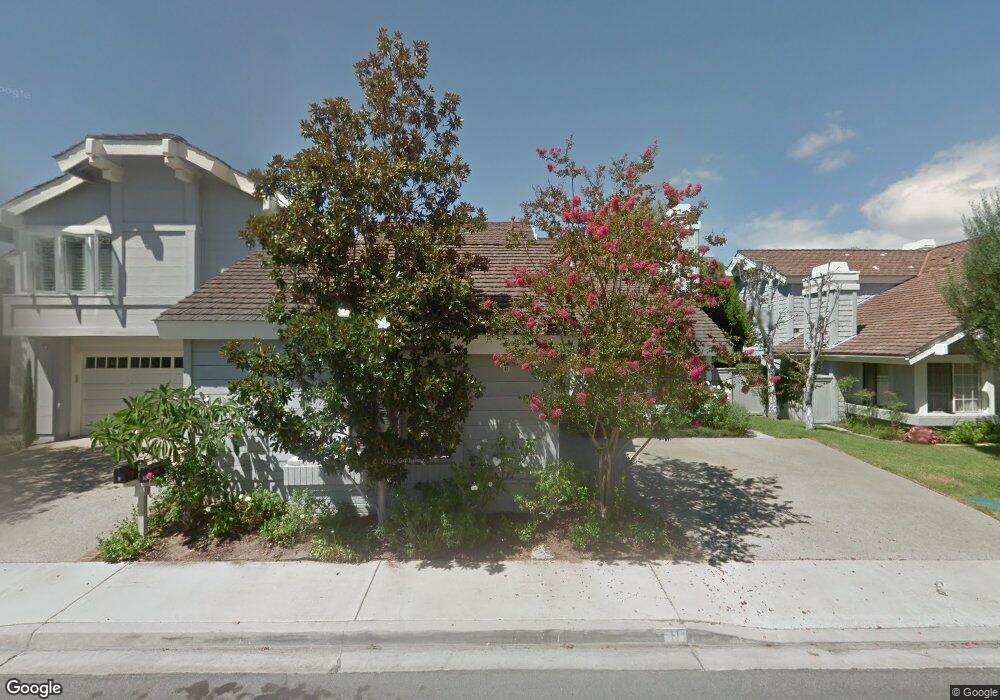
11 Silver Fern Irvine, CA 92603
Turtle Rock NeighborhoodEstimated Value: $1,879,000 - $2,742,000
3
Beds
3
Baths
2,405
Sq Ft
$1,025/Sq Ft
Est. Value
About This Home
This home is located at 11 Silver Fern, Irvine, CA 92603 and is currently estimated at $2,466,085, approximately $1,025 per square foot. 11 Silver Fern is a home located in Orange County with nearby schools including Bonita Canyon Elementary, Rancho San Joaquin Middle School, and University High School.
Ownership History
Date
Name
Owned For
Owner Type
Purchase Details
Closed on
Oct 3, 2003
Sold by
Meseck Scott R and Meseck Mercedes
Bought by
Meseck Scott and Meseck Mercedes
Current Estimated Value
Purchase Details
Closed on
Mar 14, 2002
Sold by
Luschei Erich R and Luschei Laurie May
Bought by
Meseck Scott R and Meseck Mercedes
Home Financials for this Owner
Home Financials are based on the most recent Mortgage that was taken out on this home.
Original Mortgage
$460,000
Outstanding Balance
$188,365
Interest Rate
6.78%
Estimated Equity
$2,277,720
Purchase Details
Closed on
May 7, 1999
Sold by
Lashkari Mohammad H and Lashkari Family
Bought by
Luschei Erich R and Luschei Laurie
Home Financials for this Owner
Home Financials are based on the most recent Mortgage that was taken out on this home.
Original Mortgage
$395,500
Interest Rate
7.67%
Create a Home Valuation Report for This Property
The Home Valuation Report is an in-depth analysis detailing your home's value as well as a comparison with similar homes in the area
Home Values in the Area
Average Home Value in this Area
Purchase History
We collect this data history from publicly available records. To have your information removed, we recommend requesting removal directly through your county’s website.
| Date | Buyer | Sale Price | Title Company |
|---|---|---|---|
| Meseck Scott | -- | -- | |
| Meseck Scott R | $575,000 | Chicago Title | |
| Luschei Erich R | $440,000 | Fidelity National Title Ins |
Source: Public Records
Mortgage History
We collect this data history from publicly available records. To have your information removed, we recommend requesting removal directly through your county’s website.
| Date | Status | Borrower | Loan Amount |
|---|---|---|---|
| Open | Meseck Scott R | $460,000 | |
| Previous Owner | Luschei Erich R | $395,500 |
Source: Public Records
Tax History
| Year | Tax Paid | Tax Assessment Tax Assessment Total Assessment is a certain percentage of the fair market value that is determined by local assessors to be the total taxable value of land and additions on the property. | Land | Improvement |
|---|---|---|---|---|
| 2025 | $8,928 | $849,438 | $599,027 | $250,411 |
| 2024 | $8,928 | $832,783 | $587,282 | $245,501 |
| 2023 | $8,697 | $816,454 | $575,766 | $240,688 |
| 2022 | $8,532 | $800,446 | $564,477 | $235,969 |
| 2021 | $8,337 | $784,751 | $553,408 | $231,343 |
| 2020 | $8,289 | $776,705 | $547,734 | $228,971 |
| 2019 | $8,105 | $761,476 | $536,994 | $224,482 |
| 2018 | $7,961 | $746,546 | $526,465 | $220,081 |
| 2017 | $7,796 | $731,908 | $516,142 | $215,766 |
| 2016 | $7,452 | $717,557 | $506,021 | $211,536 |
| 2015 | $7,340 | $706,779 | $498,420 | $208,359 |
| 2014 | $7,197 | $692,935 | $488,657 | $204,278 |
Source: Public Records
Map
Nearby Homes
- 10 Starfall Unit 11
- 7 Sunup
- 3 Moon Shadow
- 8 Moon Shadow Unit 8
- 8 Evening Breeze
- 2 Evening Breeze
- 15 Starshine
- 111 Hillcrest
- 6262 Sierra Palos Rd
- 5 Morningside
- 7 Sunpeak
- 16 Morning View
- 2 Saros Unit 70
- 19281 Sierra Cadiz Rd
- 6286 Sierra Siena Rd
- 9 Olympus
- 6 Sirius Unit 61
- 57 Sweet Bay
- 53 Sweet Bay
- 1 Centaurus Unit 12
- 9 Silver Fern
- 13 Silver Fern
- 7 Silver Fern
- 15 Silver Fern
- 12 Elderberry
- 10 Elderberry
- 14 Elderberry
- 5 Silver Fern
- 8 Elderberry
- 17 Silver Fern
- 10 Silver Creek Unit 33
- 16 Elderberry
- 12 Silver Fern
- 10 Silver Fern
- 14 Silver Fern
- 8 Silver Fern
- 6 Elderberry
- 8 Silver Creek Unit 32
- 8 Silver Creek
- 3 Silver Fern
Your Personal Tour Guide
Ask me questions while you tour the home.