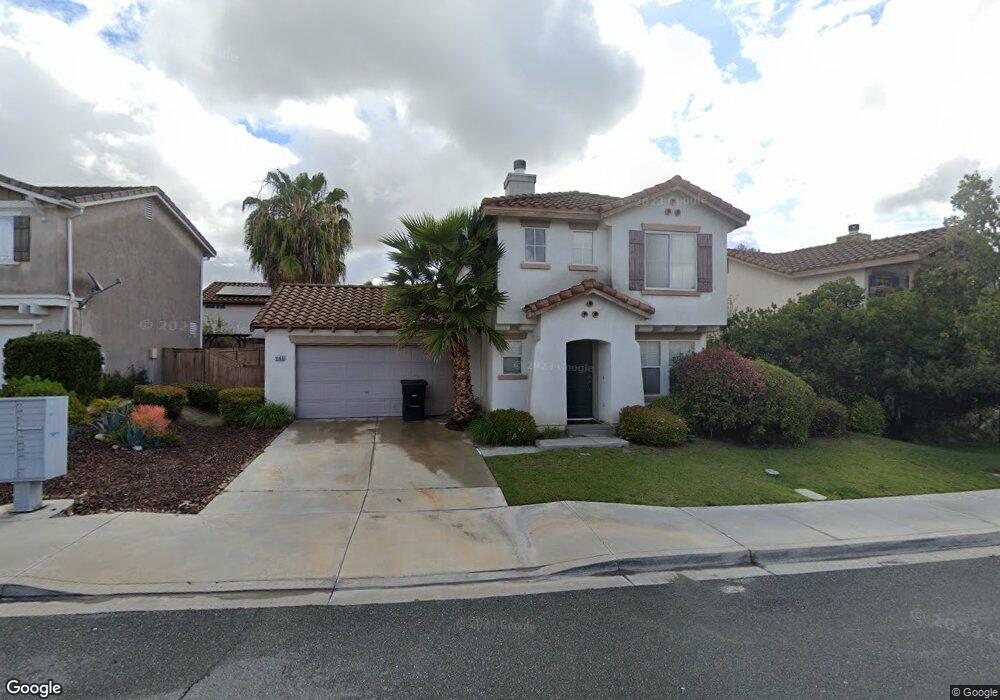
1165 Hitching Post Ln Chula Vista, CA 91915
Eastlake NeighborhoodEstimated Value: $802,000 - $896,000
3
Beds
3
Baths
1,244
Sq Ft
$671/Sq Ft
Est. Value
About This Home
This home is located at 1165 Hitching Post Ln, Chula Vista, CA 91915 and is currently estimated at $834,922, approximately $671 per square foot. 1165 Hitching Post Ln is a home located in San Diego County with nearby schools including Eastlake Middle School, Eastlake High School, and Arroyo Vista Charter School.
Ownership History
Date
Name
Owned For
Owner Type
Purchase Details
Closed on
Dec 17, 2004
Sold by
Quitasol Edgar and Quitasol Mary Grace
Bought by
Casillas Leonardo
Current Estimated Value
Home Financials for this Owner
Home Financials are based on the most recent Mortgage that was taken out on this home.
Original Mortgage
$400,000
Outstanding Balance
$200,587
Interest Rate
5.75%
Mortgage Type
Unknown
Estimated Equity
$634,335
Purchase Details
Closed on
Oct 11, 2002
Sold by
Minas Jovita R
Bought by
Quitasol Edgar and Quitasol Mary Grace
Home Financials for this Owner
Home Financials are based on the most recent Mortgage that was taken out on this home.
Original Mortgage
$260,000
Interest Rate
7.75%
Purchase Details
Closed on
May 12, 2000
Sold by
Kaufman & Broad Coastal Inc
Bought by
Minas Jovita R
Home Financials for this Owner
Home Financials are based on the most recent Mortgage that was taken out on this home.
Original Mortgage
$205,297
Interest Rate
8.37%
Mortgage Type
FHA
Create a Home Valuation Report for This Property
The Home Valuation Report is an in-depth analysis detailing your home's value as well as a comparison with similar homes in the area
Home Values in the Area
Average Home Value in this Area
Purchase History
| Date | Buyer | Sale Price | Title Company |
|---|---|---|---|
| Casillas Leonardo | $500,000 | First American Title | |
| Quitasol Edgar | $325,000 | Chicago Title Co | |
| Minas Jovita R | $207,000 | First American Title | |
| Minas Jovita R | -- | First American Title |
Source: Public Records
Mortgage History
| Date | Status | Borrower | Loan Amount |
|---|---|---|---|
| Open | Casillas Leonardo | $400,000 | |
| Previous Owner | Quitasol Edgar | $260,000 | |
| Previous Owner | Minas Jovita R | $205,297 | |
| Closed | Quitasol Edgar | $65,000 | |
| Closed | Casillas Leonardo | $100,000 |
Source: Public Records
Tax History Compared to Growth
Tax History
| Year | Tax Paid | Tax Assessment Tax Assessment Total Assessment is a certain percentage of the fair market value that is determined by local assessors to be the total taxable value of land and additions on the property. | Land | Improvement |
|---|---|---|---|---|
| 2025 | $8,591 | $696,897 | $432,078 | $264,819 |
| 2024 | $8,591 | $683,233 | $423,606 | $259,627 |
| 2023 | $8,429 | $669,837 | $415,300 | $254,537 |
| 2022 | $8,144 | $656,704 | $407,157 | $249,547 |
| 2021 | $6,575 | $520,000 | $317,000 | $203,000 |
| 2020 | $6,359 | $510,000 | $311,000 | $199,000 |
| 2019 | $6,136 | $495,000 | $302,000 | $193,000 |
| 2018 | $5,971 | $480,000 | $293,000 | $187,000 |
| 2017 | $5,641 | $450,000 | $275,000 | $175,000 |
| 2016 | $5,392 | $420,000 | $257,000 | $163,000 |
| 2015 | $4,910 | $375,000 | $230,000 | $145,000 |
| 2014 | $4,676 | $340,000 | $209,000 | $131,000 |
Source: Public Records
Map
Nearby Homes
- 1277 Granite Springs Dr
- 2300 Palomira Ct
- 2383 Forest Oaks Dr
- 1020 Baywood Cir Unit E
- 2408 Green River Dr
- 2471 Myrtle Beach Way
- 1452 S Creekside Dr
- 1246 Boca Raton Dr
- 1238 Silver Hawk Way
- 2744 Rambling Vista Rd
- 1427 Marble Canyon Way
- 2181 Caminito Norina Unit 134
- 986 White Alder Ave
- 2792 Rambling Vista Rd
- 1001 White Alder Ave
- 1436 Horn Canyon Ave
- 1498 Marble Canyon Way
- 2088 Bravo Loop
- 2065 Bravo Loop Unit 6
- 2817 Red Rock Canyon Rd
- 1169 Hitching Post Ln
- 1157 Hitching Post Ln
- 2512 Noble Canyon Rd
- 2508 Noble Canyon Rd
- 2516 Noble Canyon Rd
- 2504 Noble Canyon Rd
- 1173 Hitching Post Ln
- 1153 Hitching Post Ln
- 1166 Hitching Post Ln
- 1170 Hitching Post Ln
- 1158 Hitching Post Ln
- 2520 Noble Canyon Rd
- 2500 Noble Canyon Rd
- 1174 Hitching Post Ln
- 1149 Hitching Post Ln
- 1177 Hitching Post Ln
- 1177 Hitching Post Ln
- 1167 Chimney Flats Ln
- 1154 Hitching Post Ln
- 1171 Chimney Flats Ln