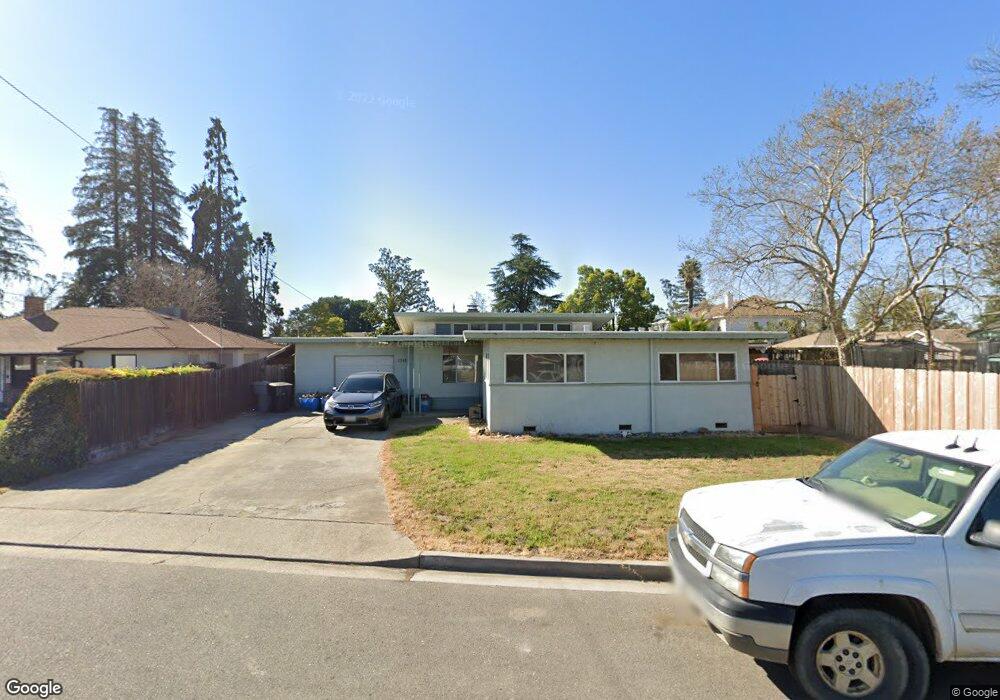
1245 Maple Dr Oakdale, CA 95361
Estimated Value: $385,420 - $412,000
3
Beds
1
Bath
1,264
Sq Ft
$312/Sq Ft
Est. Value
About This Home
This home is located at 1245 Maple Dr, Oakdale, CA 95361 and is currently estimated at $394,855, approximately $312 per square foot. 1245 Maple Dr is a home located in Stanislaus County with nearby schools including Magnolia Elementary School, Oakdale Junior High School, and East Stanislaus High School.
Ownership History
Date
Name
Owned For
Owner Type
Purchase Details
Closed on
Jul 22, 2009
Sold by
Federal Home Loan Mortgage Corporation
Bought by
Gookin Gabe
Current Estimated Value
Purchase Details
Closed on
Apr 8, 2009
Sold by
Holdaway Thomas W and Holdaway Donna E
Bought by
Federal Home Loan Mortgage Corporation
Purchase Details
Closed on
Feb 23, 2001
Sold by
Stearns Martin D and Stearns Monique
Bought by
Holdaway Thomas W and Holdaway Donna E
Home Financials for this Owner
Home Financials are based on the most recent Mortgage that was taken out on this home.
Original Mortgage
$124,150
Interest Rate
6.98%
Purchase Details
Closed on
Sep 22, 1997
Sold by
Stearns Martin D
Bought by
Stearns Martin D and Stearns Monique
Home Financials for this Owner
Home Financials are based on the most recent Mortgage that was taken out on this home.
Original Mortgage
$75,200
Interest Rate
7.54%
Create a Home Valuation Report for This Property
The Home Valuation Report is an in-depth analysis detailing your home's value as well as a comparison with similar homes in the area
Home Values in the Area
Average Home Value in this Area
Purchase History
| Date | Buyer | Sale Price | Title Company |
|---|---|---|---|
| Gookin Gabe | $105,000 | First American Title | |
| Federal Home Loan Mortgage Corporation | $157,309 | None Available | |
| Holdaway Thomas W | $128,000 | First American Title Ins Co | |
| Stearns Martin D | -- | Chicago Title Co |
Source: Public Records
Mortgage History
| Date | Status | Borrower | Loan Amount |
|---|---|---|---|
| Previous Owner | Holdaway Thomas W | $124,150 | |
| Previous Owner | Stearns Martin D | $75,200 |
Source: Public Records
Tax History
| Year | Tax Paid | Tax Assessment Tax Assessment Total Assessment is a certain percentage of the fair market value that is determined by local assessors to be the total taxable value of land and additions on the property. | Land | Improvement |
|---|---|---|---|---|
| 2025 | $1,435 | $135,519 | $64,533 | $70,986 |
| 2024 | $1,359 | $132,863 | $63,268 | $69,595 |
| 2023 | $1,329 | $130,259 | $62,028 | $68,231 |
| 2022 | $1,305 | $127,706 | $60,812 | $66,894 |
| 2021 | $1,282 | $125,203 | $59,620 | $65,583 |
| 2020 | $1,267 | $123,920 | $59,009 | $64,911 |
| 2019 | $1,246 | $121,491 | $57,852 | $63,639 |
| 2018 | $1,227 | $119,110 | $56,718 | $62,392 |
| 2017 | $1,205 | $116,775 | $55,606 | $61,169 |
| 2016 | $1,182 | $114,486 | $54,516 | $59,970 |
| 2015 | $1,166 | $112,768 | $53,698 | $59,070 |
| 2014 | $1,154 | $110,560 | $52,647 | $57,913 |
Source: Public Records
Map
Nearby Homes
- 1500 Walnut St
- 174 Warrington Ave
- 1184 River Ave
- 155 N Bryan Ave
- 621 Poplar St
- 514 California Ave
- 110 Blankenship Ave
- 1105 W G St
- 332 Hinkley Ave
- 0 Jackson Rd Unit 224058193
- 407 W H St
- 900 Old Stockton Rd Unit 511
- 237 Church Ave
- 206 S Lee Ave
- 1957 Blue Spruce Dr
- 444 N 5th Ave
- 151 S 3rd Ave
- 219 S 2nd Ave
- 1972 Sugar Pine Dr
- 161 S 3rd Ave
Your Personal Tour Guide
Ask me questions while you tour the home.