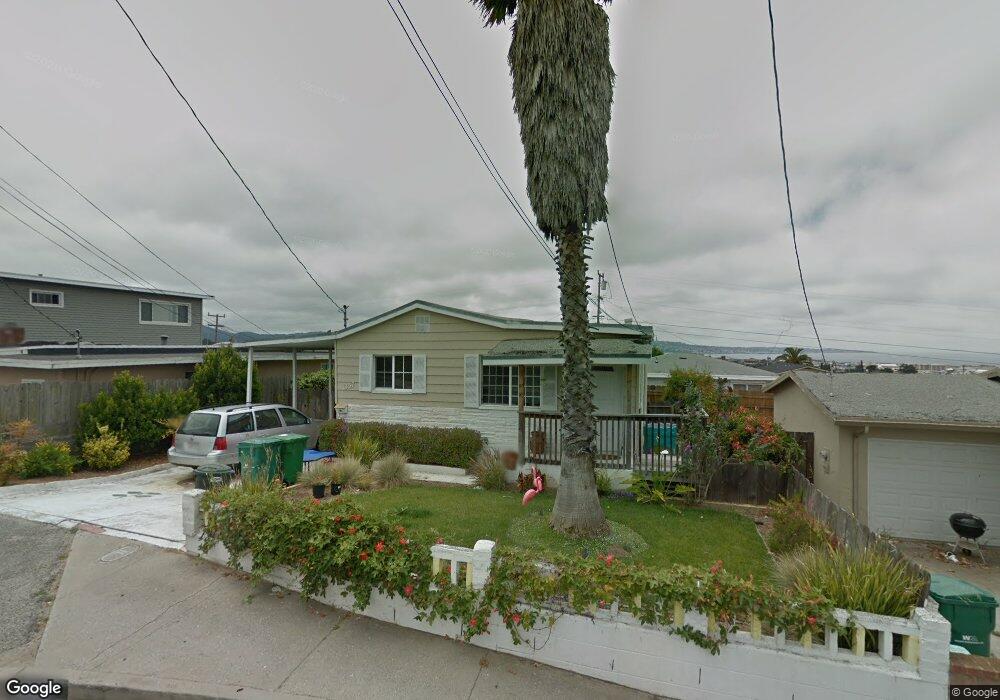
1337 Darwin St Seaside, CA 93955
Estimated Value: $678,000 - $755,000
3
Beds
2
Baths
945
Sq Ft
$755/Sq Ft
Est. Value
About This Home
This home is located at 1337 Darwin St, Seaside, CA 93955 and is currently estimated at $713,528, approximately $755 per square foot. 1337 Darwin St is a home located in Monterey County with nearby schools including Highland Elementary School, Seaside Middle School, and Seaside High School.
Ownership History
Date
Name
Owned For
Owner Type
Purchase Details
Closed on
Jun 2, 2003
Sold by
Hastings Justin
Bought by
Gardner Matthew R and Gardner Tara L
Current Estimated Value
Home Financials for this Owner
Home Financials are based on the most recent Mortgage that was taken out on this home.
Original Mortgage
$280,000
Outstanding Balance
$114,528
Interest Rate
4.87%
Mortgage Type
Purchase Money Mortgage
Estimated Equity
$599,000
Purchase Details
Closed on
Jan 31, 2001
Sold by
Menz Charles Wendell and Menz Suk Cha
Bought by
Hastings Justin
Home Financials for this Owner
Home Financials are based on the most recent Mortgage that was taken out on this home.
Original Mortgage
$237,500
Interest Rate
7.08%
Create a Home Valuation Report for This Property
The Home Valuation Report is an in-depth analysis detailing your home's value as well as a comparison with similar homes in the area
Home Values in the Area
Average Home Value in this Area
Purchase History
| Date | Buyer | Sale Price | Title Company |
|---|---|---|---|
| Gardner Matthew R | $350,000 | Stewart Title | |
| Hastings Justin | -- | Stewart Title |
Source: Public Records
Mortgage History
| Date | Status | Borrower | Loan Amount |
|---|---|---|---|
| Open | Gardner Matthew R | $280,000 | |
| Previous Owner | Hastings Justin | $237,500 | |
| Closed | Gardner Matthew R | $35,000 |
Source: Public Records
Tax History
| Year | Tax Paid | Tax Assessment Tax Assessment Total Assessment is a certain percentage of the fair market value that is determined by local assessors to be the total taxable value of land and additions on the property. | Land | Improvement |
|---|---|---|---|---|
| 2025 | $5,368 | $506,898 | $318,625 | $188,273 |
| 2024 | $5,368 | $496,960 | $312,378 | $184,582 |
| 2023 | $5,352 | $487,216 | $306,253 | $180,963 |
| 2022 | $5,278 | $477,664 | $300,249 | $177,415 |
| 2021 | $5,202 | $468,299 | $294,362 | $173,937 |
| 2020 | $5,006 | $463,498 | $291,344 | $172,154 |
| 2019 | $5,251 | $454,411 | $285,632 | $168,779 |
| 2018 | $5,043 | $445,502 | $280,032 | $165,470 |
| 2017 | $4,159 | $395,000 | $248,000 | $147,000 |
| 2016 | $3,976 | $377,000 | $237,000 | $140,000 |
| 2015 | $3,314 | $314,000 | $197,000 | $117,000 |
| 2014 | $3,121 | $295,000 | $185,000 | $110,000 |
Source: Public Records
Map
Nearby Homes
- 1313 Harding St
- 1330 Flores St
- 1516 Hilby Ave
- 1425 Luxton St
- 1184 Barbara Ct
- 1282 Hamilton Ave
- 1610 Soto St
- 1364 Skyview Dr
- 1224 Trinity Ave Unit 14
- 1640 Judson St
- 1212 Trinity Ave Unit 10
- 1233 Hilby Ave
- 1460 Mescal St
- 1659 Judson St
- 1688 Harding St
- 1675 Luxton St
- 1148 San Lucas St
- 1666 Hilton St
- 1714 Luxton St
- 1140 Palm Ave
- 1323 Darwin St
- 1349 Darwin St
- 1336 Harding St
- 1324 Harding St
- 1313 Darwin St
- 1348 Harding St
- 1318 Harding St
- 1336 Darwin St
- 1361 Darwin St
- 1354 Darwin St
- 1301 Darwin St
- 1300 Harding St
- 1360 Harding St
- 1360 Darwin St
- 1373 Darwin St
- 1337 Vallejo St
- 1325 Harding St
- 1337 Harding St
- 1349 Vallejo St
- 1355 Harding St
Your Personal Tour Guide
Ask me questions while you tour the home.