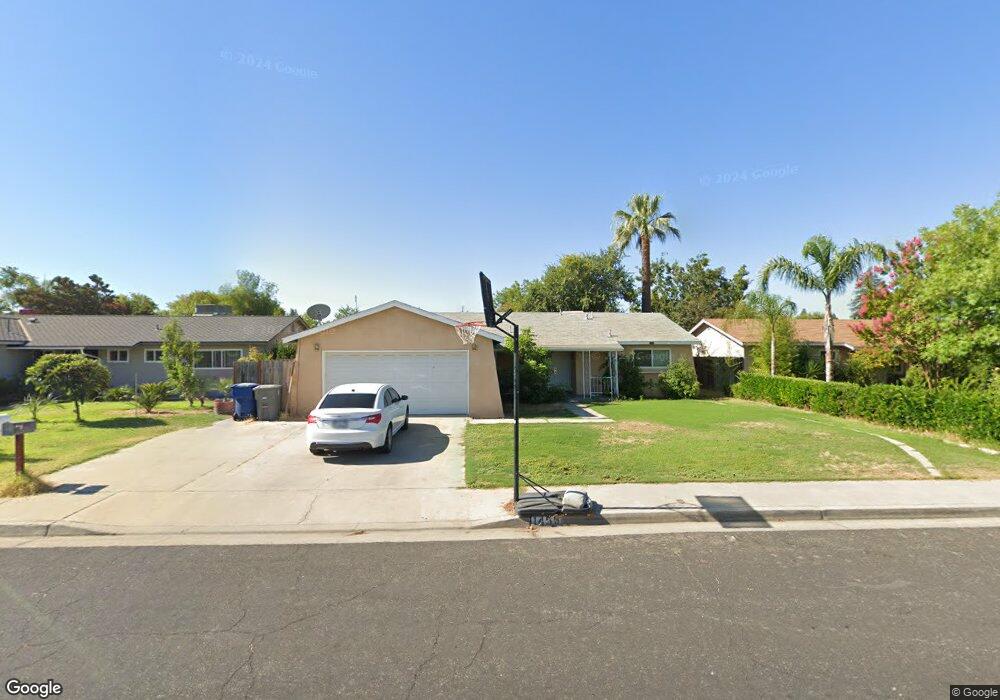
1456 Roberts Ave Clovis, CA 93611
Estimated Value: $271,000 - $385,000
3
Beds
2
Baths
1,307
Sq Ft
$258/Sq Ft
Est. Value
About This Home
This home is located at 1456 Roberts Ave, Clovis, CA 93611 and is currently estimated at $337,586, approximately $258 per square foot. 1456 Roberts Ave is a home located in Fresno County with nearby schools including Clovis Elementary School, Clark Intermediate School, and Clovis High School.
Ownership History
Date
Name
Owned For
Owner Type
Purchase Details
Closed on
Mar 13, 2024
Sold by
Deng Ri Sheng and Hui Ping
Bought by
Rhvb Family Trust and Deng
Current Estimated Value
Purchase Details
Closed on
Feb 26, 2024
Sold by
Deng Ri Sheng and Hui Ping
Bought by
Rhvb Family Trust and Deng
Purchase Details
Closed on
Oct 17, 2011
Sold by
Us Bank National Association
Bought by
Deng Ri Sheng
Purchase Details
Closed on
May 27, 2011
Sold by
Hyson Julie Lea
Bought by
U S Bank National Association
Purchase Details
Closed on
Jul 24, 2006
Sold by
Riffle Deborah L
Bought by
Hyson Julie Lea
Home Financials for this Owner
Home Financials are based on the most recent Mortgage that was taken out on this home.
Original Mortgage
$237,500
Interest Rate
7.87%
Mortgage Type
Negative Amortization
Create a Home Valuation Report for This Property
The Home Valuation Report is an in-depth analysis detailing your home's value as well as a comparison with similar homes in the area
Home Values in the Area
Average Home Value in this Area
Purchase History
| Date | Buyer | Sale Price | Title Company |
|---|---|---|---|
| Rhvb Family Trust | -- | None Listed On Document | |
| Rhvb Family Trust | -- | None Listed On Document | |
| Deng Ri Sheng | $95,500 | Landsafe Title | |
| U S Bank National Association | $122,500 | None Available | |
| Hyson Julie Lea | $250,000 | First American Title Company |
Source: Public Records
Mortgage History
| Date | Status | Borrower | Loan Amount |
|---|---|---|---|
| Previous Owner | Hyson Julie Lea | $237,500 |
Source: Public Records
Tax History
| Year | Tax Paid | Tax Assessment Tax Assessment Total Assessment is a certain percentage of the fair market value that is determined by local assessors to be the total taxable value of land and additions on the property. | Land | Improvement |
|---|---|---|---|---|
| 2025 | $1,430 | $119,313 | $37,676 | $81,637 |
| 2023 | $1,377 | $114,682 | $36,214 | $78,468 |
| 2022 | $1,359 | $112,434 | $35,504 | $76,930 |
| 2021 | $1,322 | $110,230 | $34,808 | $75,422 |
| 2020 | $1,317 | $109,101 | $34,452 | $74,649 |
| 2019 | $1,291 | $106,963 | $33,777 | $73,186 |
| 2018 | $1,264 | $104,866 | $33,115 | $71,751 |
| 2017 | $1,243 | $102,811 | $32,466 | $70,345 |
| 2016 | $1,201 | $100,796 | $31,830 | $68,966 |
| 2015 | $1,183 | $99,283 | $31,352 | $67,931 |
| 2014 | $1,162 | $97,339 | $30,738 | $66,601 |
Source: Public Records
Map
Nearby Homes
- 760 Sunnyside Ave
- 1228 Jefferson Ave
- 1272 Bullard Ave
- 1606 Barstow Ave
- 1428 Miami Ave
- 860 Mcarthur Ave
- 1622 Dennis Ave
- 1273 Bundy Ave
- 1498 Escalon Ave
- 1334 Shirley Ave
- 1721 Beverly Ave
- 1515 Keats Ave
- 1876 Cougar Ln
- 1946 Calimyrna Ave
- 1895 Dennis Ave
- 1584 Laverne Ave
- 1855 Vartikian Ave
- 2034 Wrenwood Ave
- 96 Burgan Ave
- 2214 Fordham Ave
- 1448 Roberts Ave
- 1468 Roberts Ave
- 1455 Browning Ave
- 1465 Browning Ave
- 1447 Browning Ave
- 1478 Roberts Ave
- 1436 Roberts Ave
- 1475 Browning Ave
- 1435 Browning Ave
- 1447 Roberts Ave
- 1467 Roberts Ave
- 1426 Roberts Ave
- 1437 Roberts Ave
- 1479 Roberts Ave
- 1425 Browning Ave
- 1427 Roberts Ave
- 1456 Browning Ave
- 1416 Roberts Ave
- 1491 Roberts Ave
Your Personal Tour Guide
Ask me questions while you tour the home.