Estimated Value: $436,000 - $493,000
3
Beds
2
Baths
1,381
Sq Ft
$341/Sq Ft
Est. Value
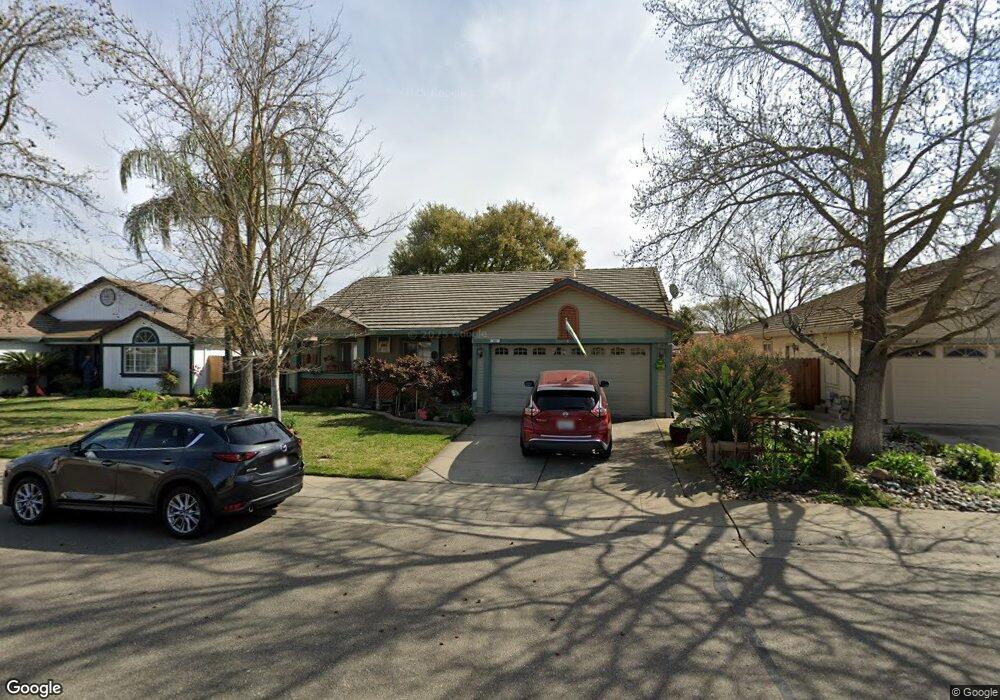
About This Home
This home is located at 161 Wagon Way, Galt, CA 95632 and is currently estimated at $471,371, approximately $341 per square foot. 161 Wagon Way is a home located in Sacramento County with nearby schools including Valley Oaks Elementary School, Robert L. McCaffrey Middle School, and Galt High School.
Ownership History
Date
Name
Owned For
Owner Type
Purchase Details
Closed on
Aug 26, 2005
Sold by
Welch Christopher and Welch Lucila
Bought by
Piazzese Perez Rose M
Current Estimated Value
Home Financials for this Owner
Home Financials are based on the most recent Mortgage that was taken out on this home.
Original Mortgage
$175,300
Outstanding Balance
$92,900
Interest Rate
5.7%
Mortgage Type
Fannie Mae Freddie Mac
Estimated Equity
$378,471
Purchase Details
Closed on
Jun 6, 2000
Sold by
Root Jack C and Root Karin Elfriede
Bought by
Welch Christopher and Welch Lucila
Home Financials for this Owner
Home Financials are based on the most recent Mortgage that was taken out on this home.
Original Mortgage
$131,900
Interest Rate
8.27%
Create a Home Valuation Report for This Property
The Home Valuation Report is an in-depth analysis detailing your home's value as well as a comparison with similar homes in the area
Home Values in the Area
Average Home Value in this Area
Purchase History
| Date | Buyer | Sale Price | Title Company |
|---|---|---|---|
| Piazzese Perez Rose M | $376,000 | Chicago Title Co | |
| Welch Christopher | $136,000 | Alliance Title Company |
Source: Public Records
Mortgage History
| Date | Status | Borrower | Loan Amount |
|---|---|---|---|
| Open | Piazzese Perez Rose M | $175,300 | |
| Previous Owner | Welch Christopher | $131,900 |
Source: Public Records
Tax History
| Year | Tax Paid | Tax Assessment Tax Assessment Total Assessment is a certain percentage of the fair market value that is determined by local assessors to be the total taxable value of land and additions on the property. | Land | Improvement |
|---|---|---|---|---|
| 2025 | $5,789 | $513,816 | $163,980 | $349,836 |
| 2024 | $5,789 | $503,742 | $160,765 | $342,977 |
| 2023 | $6,004 | $493,865 | $157,613 | $336,252 |
| 2022 | $5,559 | $464,000 | $115,000 | $349,000 |
| 2021 | $5,269 | $428,697 | $136,815 | $291,882 |
| 2020 | $4,684 | $376,051 | $120,014 | $256,037 |
| 2019 | $4,405 | $353,101 | $112,690 | $240,411 |
| 2018 | $4,322 | $339,521 | $108,356 | $231,165 |
| 2017 | $3,900 | $308,656 | $98,506 | $210,150 |
| 2016 | $3,525 | $280,597 | $89,551 | $191,046 |
| 2015 | $3,350 | $269,806 | $86,107 | $183,699 |
| 2014 | $3,155 | $247,528 | $78,997 | $168,531 |
Source: Public Records
Map
Nearby Homes
Your Personal Tour Guide
Ask me questions while you tour the home.